Multi Timeframe Momentum Breakout Strategy

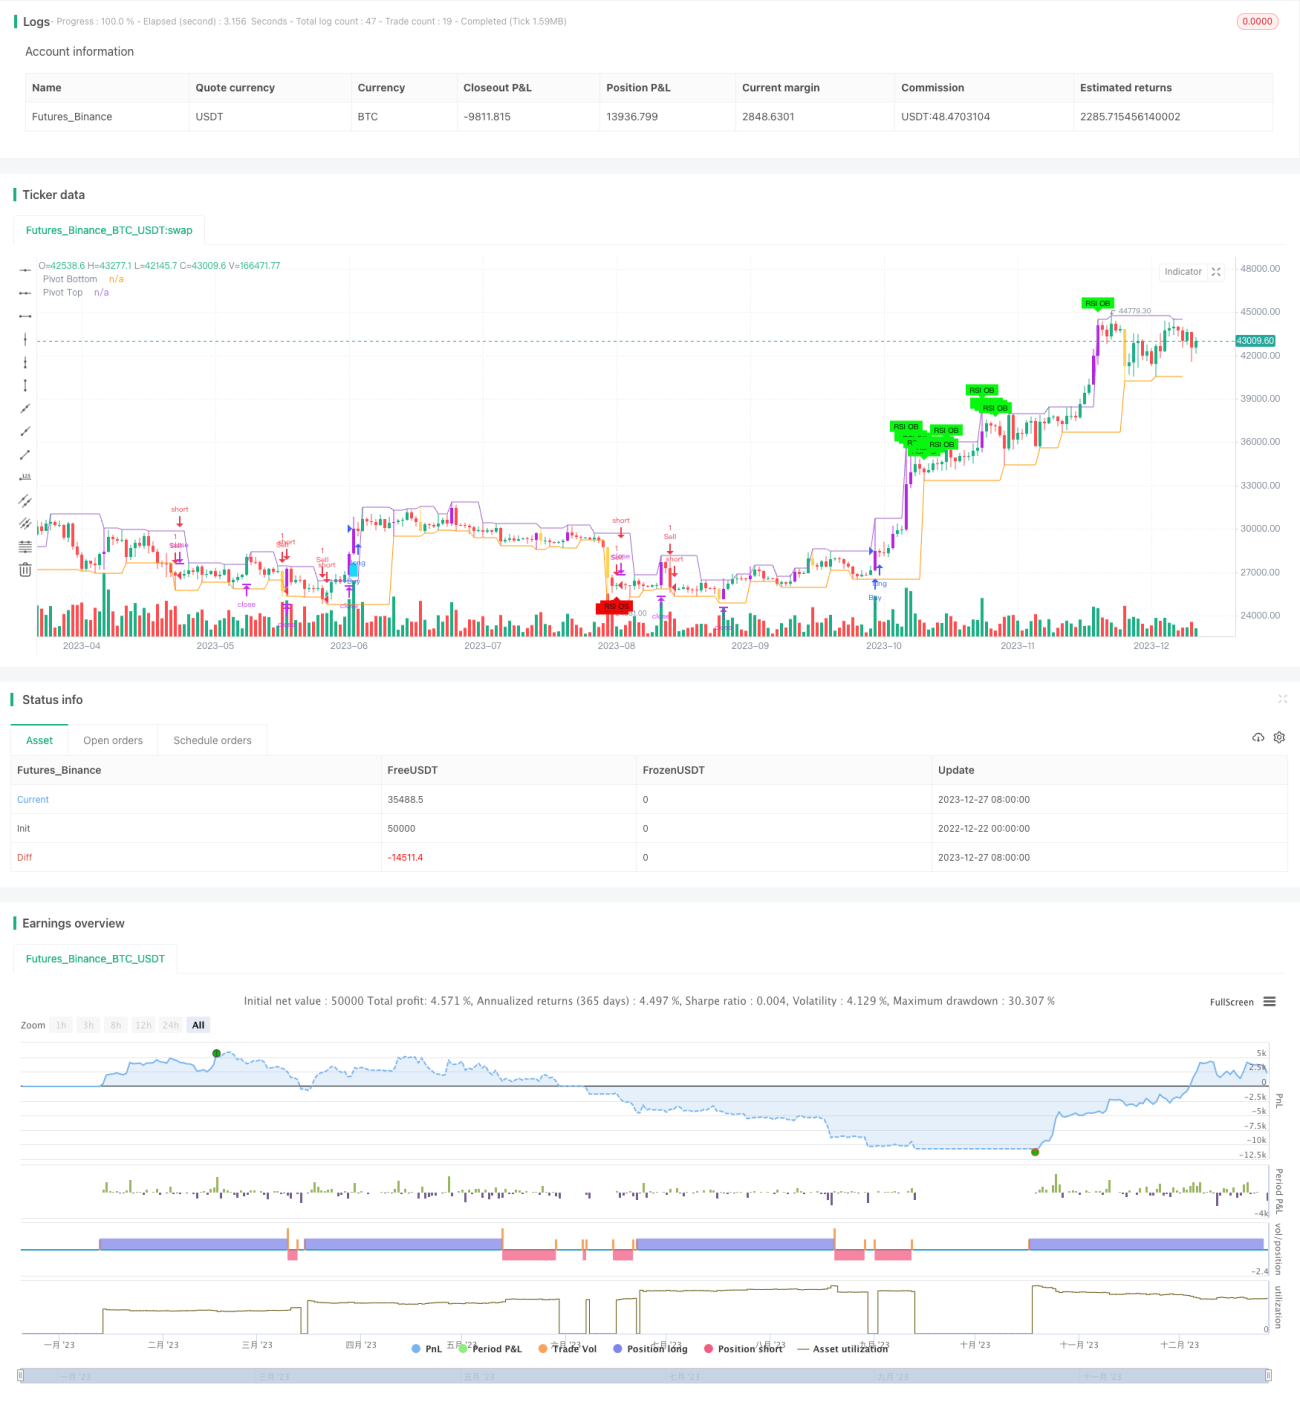
Overview
This strategy combines multiple technical indicators like RSI, ADX, ATR and momentum to identify trends and capture breakout points. It also uses Fibonacci retracements and moving averages to further improve identification of key levels and trends.
Strategy Logic
-
Use RSI, ADX, DI+, DI- etc to determine trend direction and strength. RSI shows overbought/oversold levels, ADX shows trend strength, while DI+/DI- indicate bullish/bearish trends. These indicators are displayed in a table for easy reference.
-
Use moving averages to determine trend direction. 5 & 9-day EMAs define short-term trend, 21-day WMA medium-term trend and 60-day WMA long-term trend. Golden cross signals potential uptrend.
-
Identify key 0.5, 0.618 Fibonacci retracement levels that often act as support/resistance zones for reversal.
-
Set stop loss based on ATR and stop loss % to control risk. Take profit based on ATR and take profit % to lock in gains.
-
Consider reversal on RSI overbought/oversold signals. Consider riding trend on golden cross with increased volume. Set stop loss and take profit after entry.
Advantage Analysis
-
Combination of indicators improves decision accuracy on trend and strength.
-
ATR-based stop loss & take profit controls risk effectively.
-
Fibonacci improves identification of reversal points.
-
Volume filter avoids false breakouts when following trends.
-
Table provides clear view of indicator values for quick decisions.
Risk Analysis
-
Possibility of inaccurate signals cannot be fully avoided, causing incorrect trades. Can optimize parameters to improve indicator accuracy.
-
ATR and stop loss % affects actual stop loss price. Inappropriate setting can increase risk. Requires fine tuning.
-
Volume filter cannot fully avoid false breakouts. Needs checking price action details.
-
Fibonacci levels not always reliable. Price may break through completely.
Optimization Directions
-
Test and optimize parameters like RSI, ADX, ATR to find best combinations.
-
Test different moving average combinations for best trend identification.
-
Test different stop loss/take profit ratios for best risk-reward.
-
Consider adding Bollinger Bands to check for volume expansion.
Conclusion
This strategy combines trend analysis, key level identification, volume analysis and more. Further parameter optimization can improve accuracy and profitability. Stop loss & take profit manages risk and maximizes reward. It is effective in gauging medium-long term trends and capturing short-term reversals. Continued optimizations can make the strategy more robust.
- 1