Daily Breakout Strategy

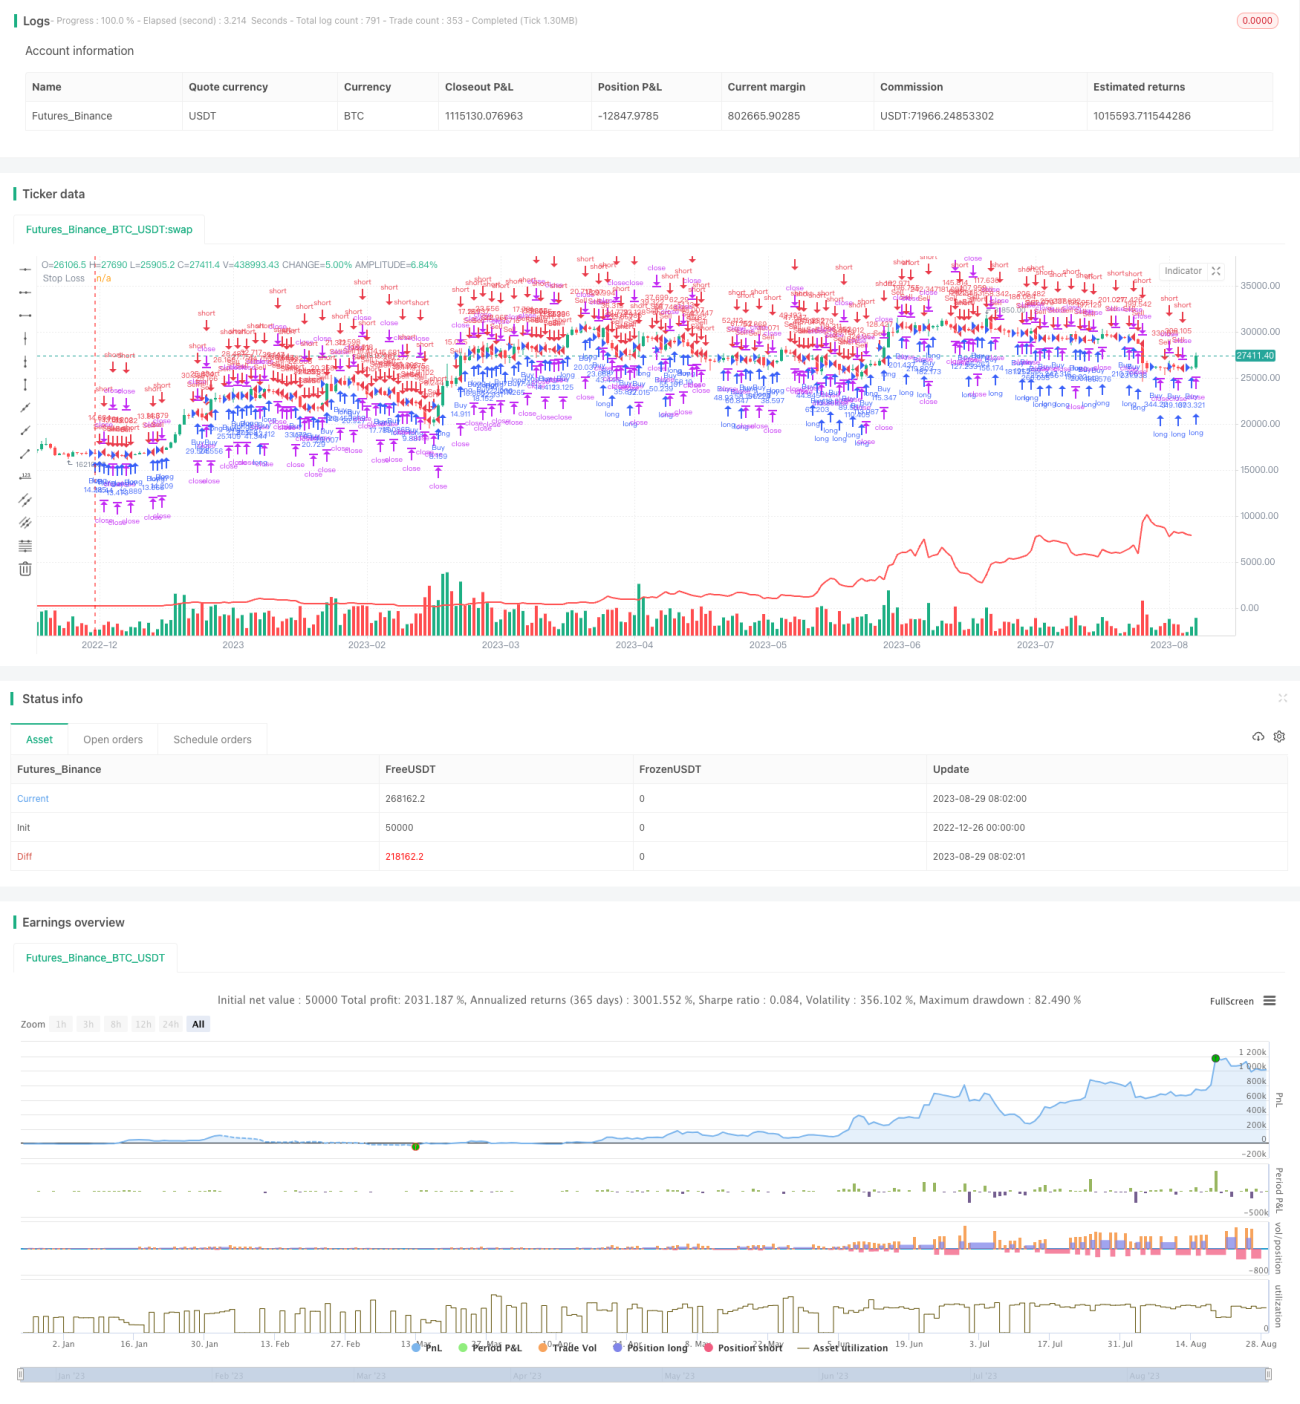
Overview
The daily breakout strategy is a simple trend following strategy based on daily candlestick charts. It generates trading signals by observing the relationship between the previous day's opening and closing prices to determine market momentum.
Strategy Logic
The core logic of this strategy is:
If the previous day's candlestick body is green (closing price higher than opening price), it indicates an upward trend on that day. The strategy will go long at the next day's opening. If the previous day's candlestick body is red (closing price lower than opening price), it indicates a downward trend. The strategy will go short at the next day's opening.
By this simple way, the strategy can identify the market momentum within the recent one candlestick cycle and make trades accordingly. This allows the strategy to follow the latest market trend.
Specifically, the strategy generates trading signals as follows:
- Get the previous trading day's candlestick data at market open each day
- Compare the opening and closing prices of that candlestick
- If open < close (green candlestick), generate long signal, go long at a percentage of available funds
- If open > close (red candlestick), generate short signal, go short at a percentage of available funds
- Use stop loss to exit positions
Through this logic, the strategy can capitalize on short-term price trends.
Advantages
The main advantages of this strategy include:
- Simplicity - The core logic directly compares candlestick color and is very simple and clear.
- Trend following - It identifies the trend direction of the latest trading day, following shorter-term momentum.
- Flexibility - Parameters like position sizing, stop loss can be adjusted to modify risk vs. reward.
- Optimization potential - More enhancements can be added, like multiple timeframe analysis and data fitting to improve robustness.
Risks and Improvements
Some risks and improvement areas:
- Whipsaw risk - It only looks at the daily candle, so may falsely buy pullbacks instead of actual trend in ranging markets. Additional timeframe or indicators can be added to judge consolidation.
- Shorting risk - Short positions have unlimited downside risk. Strict stop loss needs to be implemented.
- Parameter tuning - Fine tune stop loss level, position sizing etc. to achieve better risk-adjusted returns.
- Add indicators - Incorporate more technical indicators to improve robustness and stability.
Conclusion
The daily breakout strategy identifies market momentum through simple and effective comparison of daily candlesticks, allowing it to trade in the direction of shorter-term trends. While simple and easy to implement, it has whipsaw risks. Further optimizations on parameters and additional indicators can enhance strategy reliability.
/*backtest
start: 2022-12-26 00:00:00
end: 2023-08-30 00:00:00
period: 1d
basePeriod: 1h
exchanges: [{"eid":"Futures_Binance","currency":"BTC_USDT"}]
*/

//@version=5
strategy("Daily Candle Strategy", overlay=true, default_qty_type=strategy.percent_of_equity, default_qty_value=0.0)

// Input parameters- 1