Dual EMA Crossover Oscillation Tracking Strategy

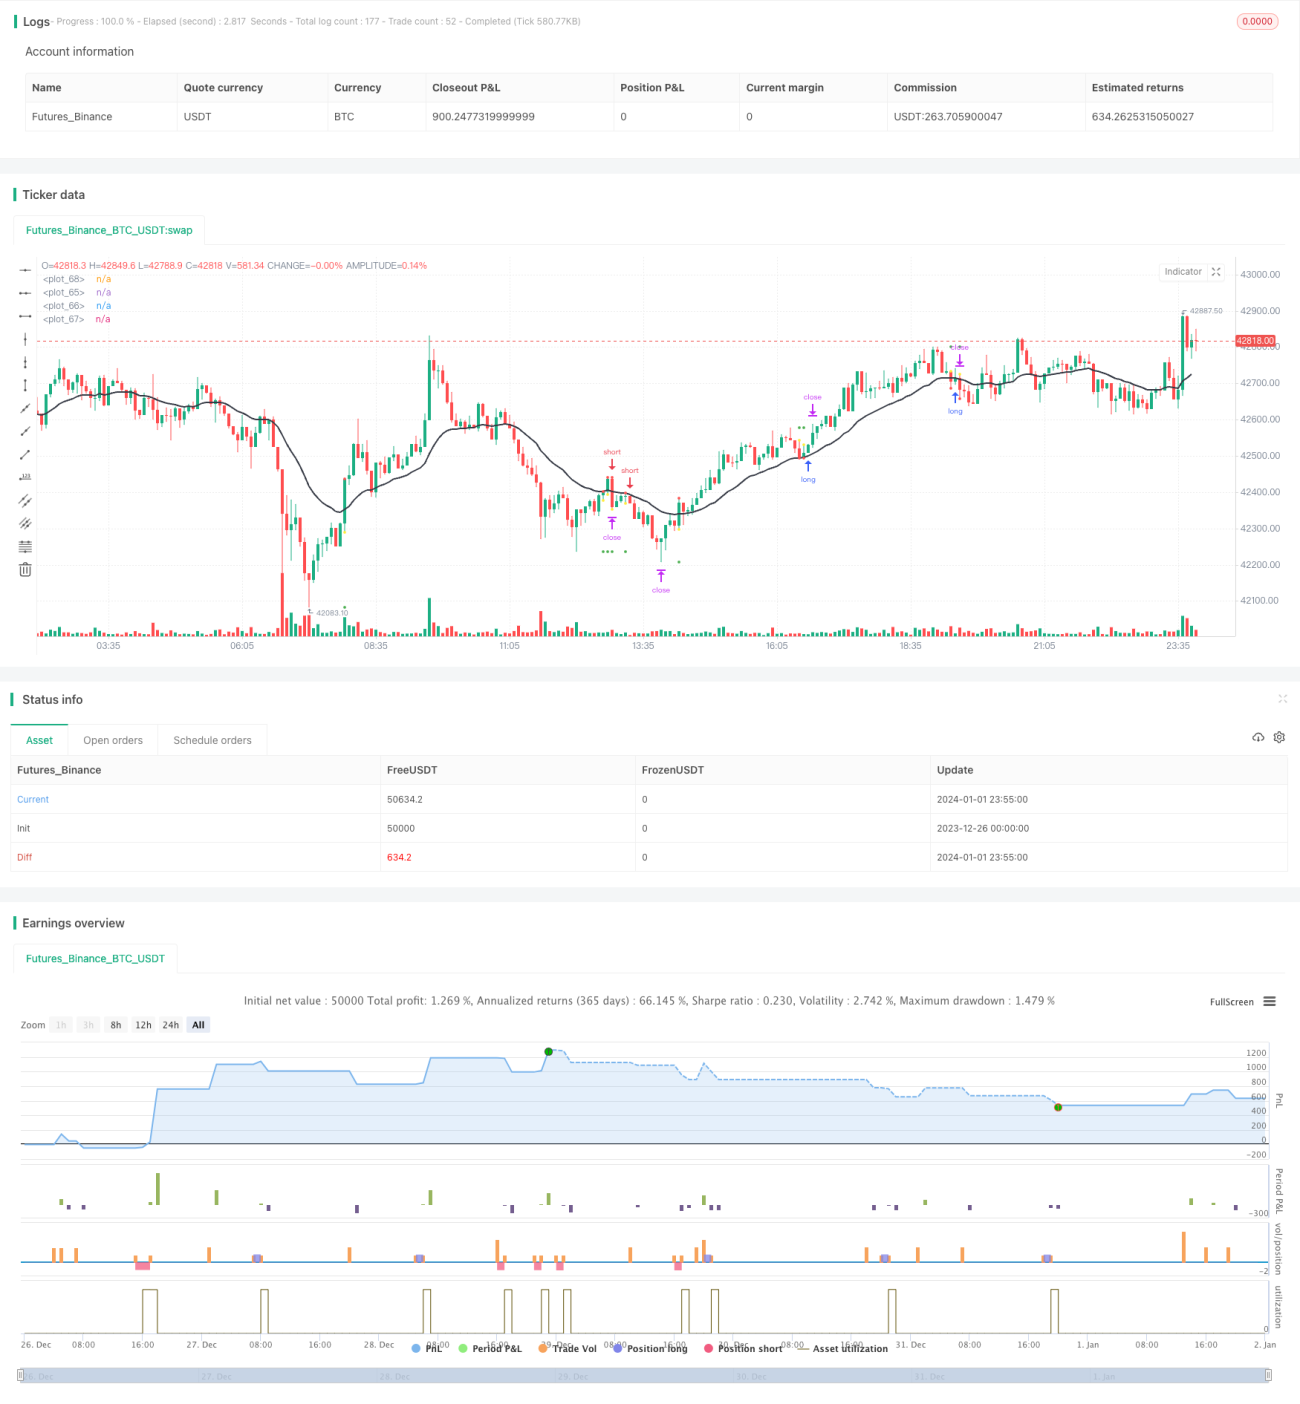
Overview
The Dual EMA Crossover Oscillation Tracking strategy is a strategy that identifies trends using the EMA indicator and tracks oscillations during volatile market conditions. This strategy incorporates both the concepts of trend tracking and oscillation capturing. It aims to achieve better returns by conducting long-term tracking during strong trends and short-term trading during oscillations.
Strategy Logic
This strategy uses the 20-period EMA as an indicator for judging trends. When the price crosses above the EMA, it signals an upward trend, and when the price crosses below, it signals a downward trend.
When the price crosses above the EMA, a long position is entered using the highest price over the past 20 periods as the take profit and the lowest low since the crossover as the stop loss. When the price crosses below the EMA, a short position is entered using the lowest price over the past 20 periods as the take profit and the highest high since the crossover as the stop loss.
At the same time, the strategy also checks if the ADX is above 30. Trades are only taken when the trend is strong enough, i.e. when the ADX is higher than 30. This avoids stop outs during market oscillations.
During open trades, the trailing stop continues to adjust based on market conditions to lock in more profits.
Advantage Analysis
This strategy combines the advantages of both trend tracking and oscillation trading. It can produce higher returns during trending markets and more consistent returns during oscillations. The adaptability is strong.
The use of EMA also keeps the parameters simple, lowering the risks of overoptimization and ensuring stability.
Risk Analysis
The main risk of this strategy is the possibility of more frequent stop outs during intensified oscillations. This is where the ADX comes into play. By disabling trading when ADX is low, losses in the absence of a clear trend can be avoided.
In addition, proper stop loss placement is also key. Excessively wide stops may increase single trade loss amount. Excessively tight stops may be too sensitive and increase stop out probability. A balance needs to be found between profit targets and stop loss risks.
Optimization Directions
Possible optimizations for this strategy include:
-
Testing more EMA periods to find the optimal combination.
-
Optimizing ADX parameters including the ADX period and threshold values.
-
Improving the profit taking and stop loss algorithms, for example by introducing dynamic stops.
-
Combining additional indicators like KDJ and MACD to create a multi-indicator confirmation system.
Summary
In summary, the Dual EMA Crossover Oscillation Tracking strategy is a highly practical strategy. It combines the strengths of both trend trading strategies and oscillation strategies. It can be used for both long-term tracking and short-term trading. Further improvements in performance can be achieved through parameter optimization and adding confirming indicators. It suits investors with some degree of analytical capabilities regarding market conditions.
/*backtest
start: 2023-12-26 00:00:00
end: 2024-01-02 00:00:00
period: 5m
basePeriod: 1m
exchanges: [{"eid":"Futures_Binance","currency":"BTC_USDT"}]
*/

//@version=2
strategy("Linda Raschke's Holy Grail", shorttitle="RHG", default_qty_type = strategy.percent_of_equity, default_qty_value = 100, overlay = true)
adxlen = input(14, title="ADX period")
adxMin = input(30)- 1