The Gaussian Moving Average Trading Strategy

Overview
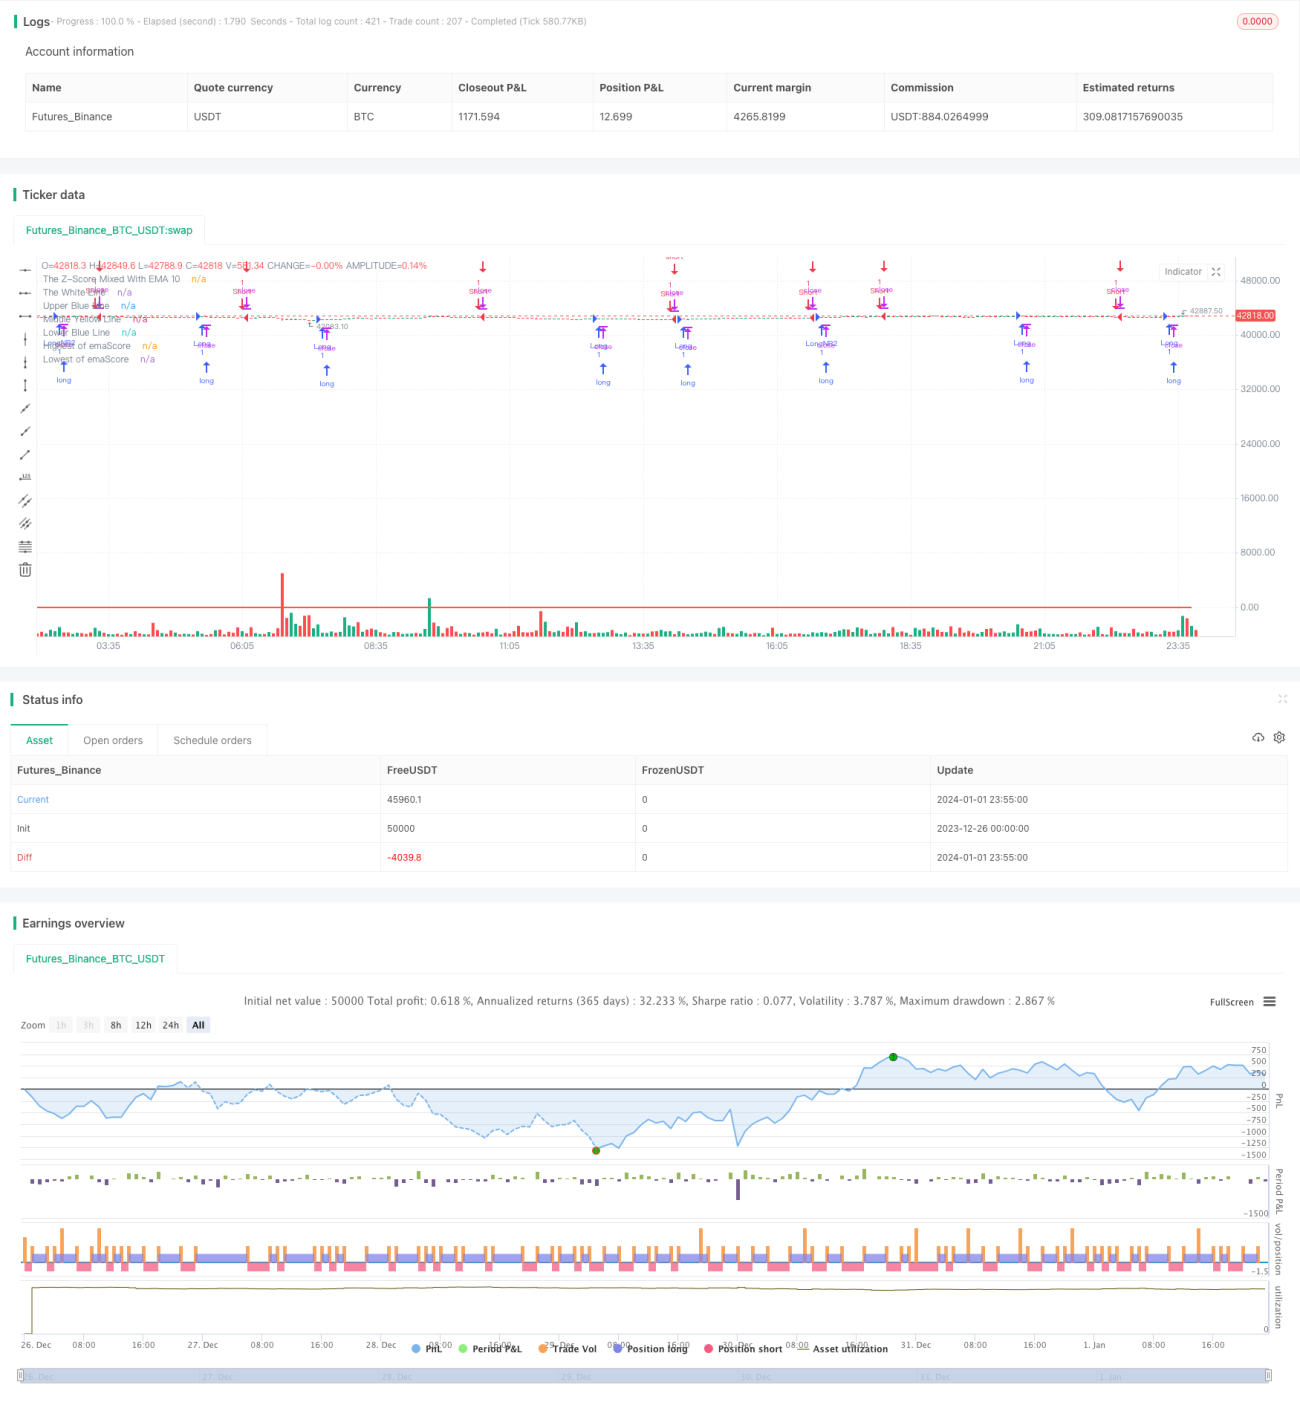
This strategy applies the idea of Gaussian distribution and calculates the Z-score based on the 10-period exponential moving average of Heikin-Ashi candlestick closing prices. The thresholds are then set based on the 20-period exponential moving average of the Z-score for entry and exit signals when the curve crosses them.
Strategy Logic
-
Calculate the 10-period exponential moving average of Heikin-Ashi candlestick closing prices.
-
Based on the above moving average data, calculate the Z-score over a 25-period lookback window. The Z-score reflects how many standard deviations a data point is from the mean, which can judge whether the data is normal or abnormal.
-
Take the 20-period exponential moving average on the Z-score to get a curve called emaScore. This curve reflects the long term trend of the Z-score.
-
Set upper and lower thresholds based on the distribution of emaScore data. Considering some fluctuations of the curve, the 90% and 10% levels are chosen as thresholds.
-
Long when emaScore crosses middle line or lower threshold upwards. Short when emaScore crosses upper threshold, lower threshold or 100-period highest downwards.
Advantage Analysis
-
Apply Gaussian distribution idea through Z-score to judge normality and filter false breakouts.
-
The double exponential moving average has a filtering effect to determine long term trend.
-
Reasonable threshold setting lowers incorrect trading probabilities.
-
Incorporating 100-period highest/lowest points helps catch reversal opportunities.
Risk Analysis
-
Combination of Z-score and MAs is sensitive to parameters tuning. Optimization needed.
-
Proper threshold levels directly relate to strategy validity. Too wide or narrow will fail.
-
100-period highest/lowest points can easily generate wrong signals. Relax conditions appropriately.
-
Heikin-Ashi itself has some lag. Evaluate fit for this strategy.
Optimization Directions
-
Test different moving averages periods, Z-score lookback windows.
-
Utilize walk forward analysis to auto optimize parameters.
-
Try different threshold setting methods, e.g. STD multiples.
-
Improve highest/lowest points logic to prevent wrong signals.
-
Test other candle types or typical prices to replace Heikin-Ashi.
Summary
This strategy judges price abnormality and generates trading signals based on the idea of Gaussian distribution, double exponential moving averages and dynamic threshold setting. The main advantages are filtering false breakouts and catching reversals. However, huge impact exists regarding parameters selection and combination. Further tests and optimization are needed to find the best parameters and combinations.
- 1