Overview
The Quant Trend Following Strategy is a trend tracking strategy based on EMA lines and ATR stop loss. It uses EMA lines to judge the overall market trend direction, and dynamically tracks stop loss with ATR to lock in trend profits, maximizing returns.
Principles
The strategy consists of the following main parts:
- EMA lines to determine primary trend
Use 13-day, 50-day and 100-day lines to form bullish/bearish bias and judge primary trend direction.
- ATR dynamic stop loss
Use ATR indicator to calculate price movement range of current period and set stop loss price to lock in profits.
- Signal smoothing
Smooth closing prices over a certain period with SMA to avoid false signals.
- Bullish/bearish signals
Go long when price crosses over EMA lines, go short when crosses below. Set dynamic ATR trailing stop loss.
Advantage Analysis
The strategy has the following advantages:
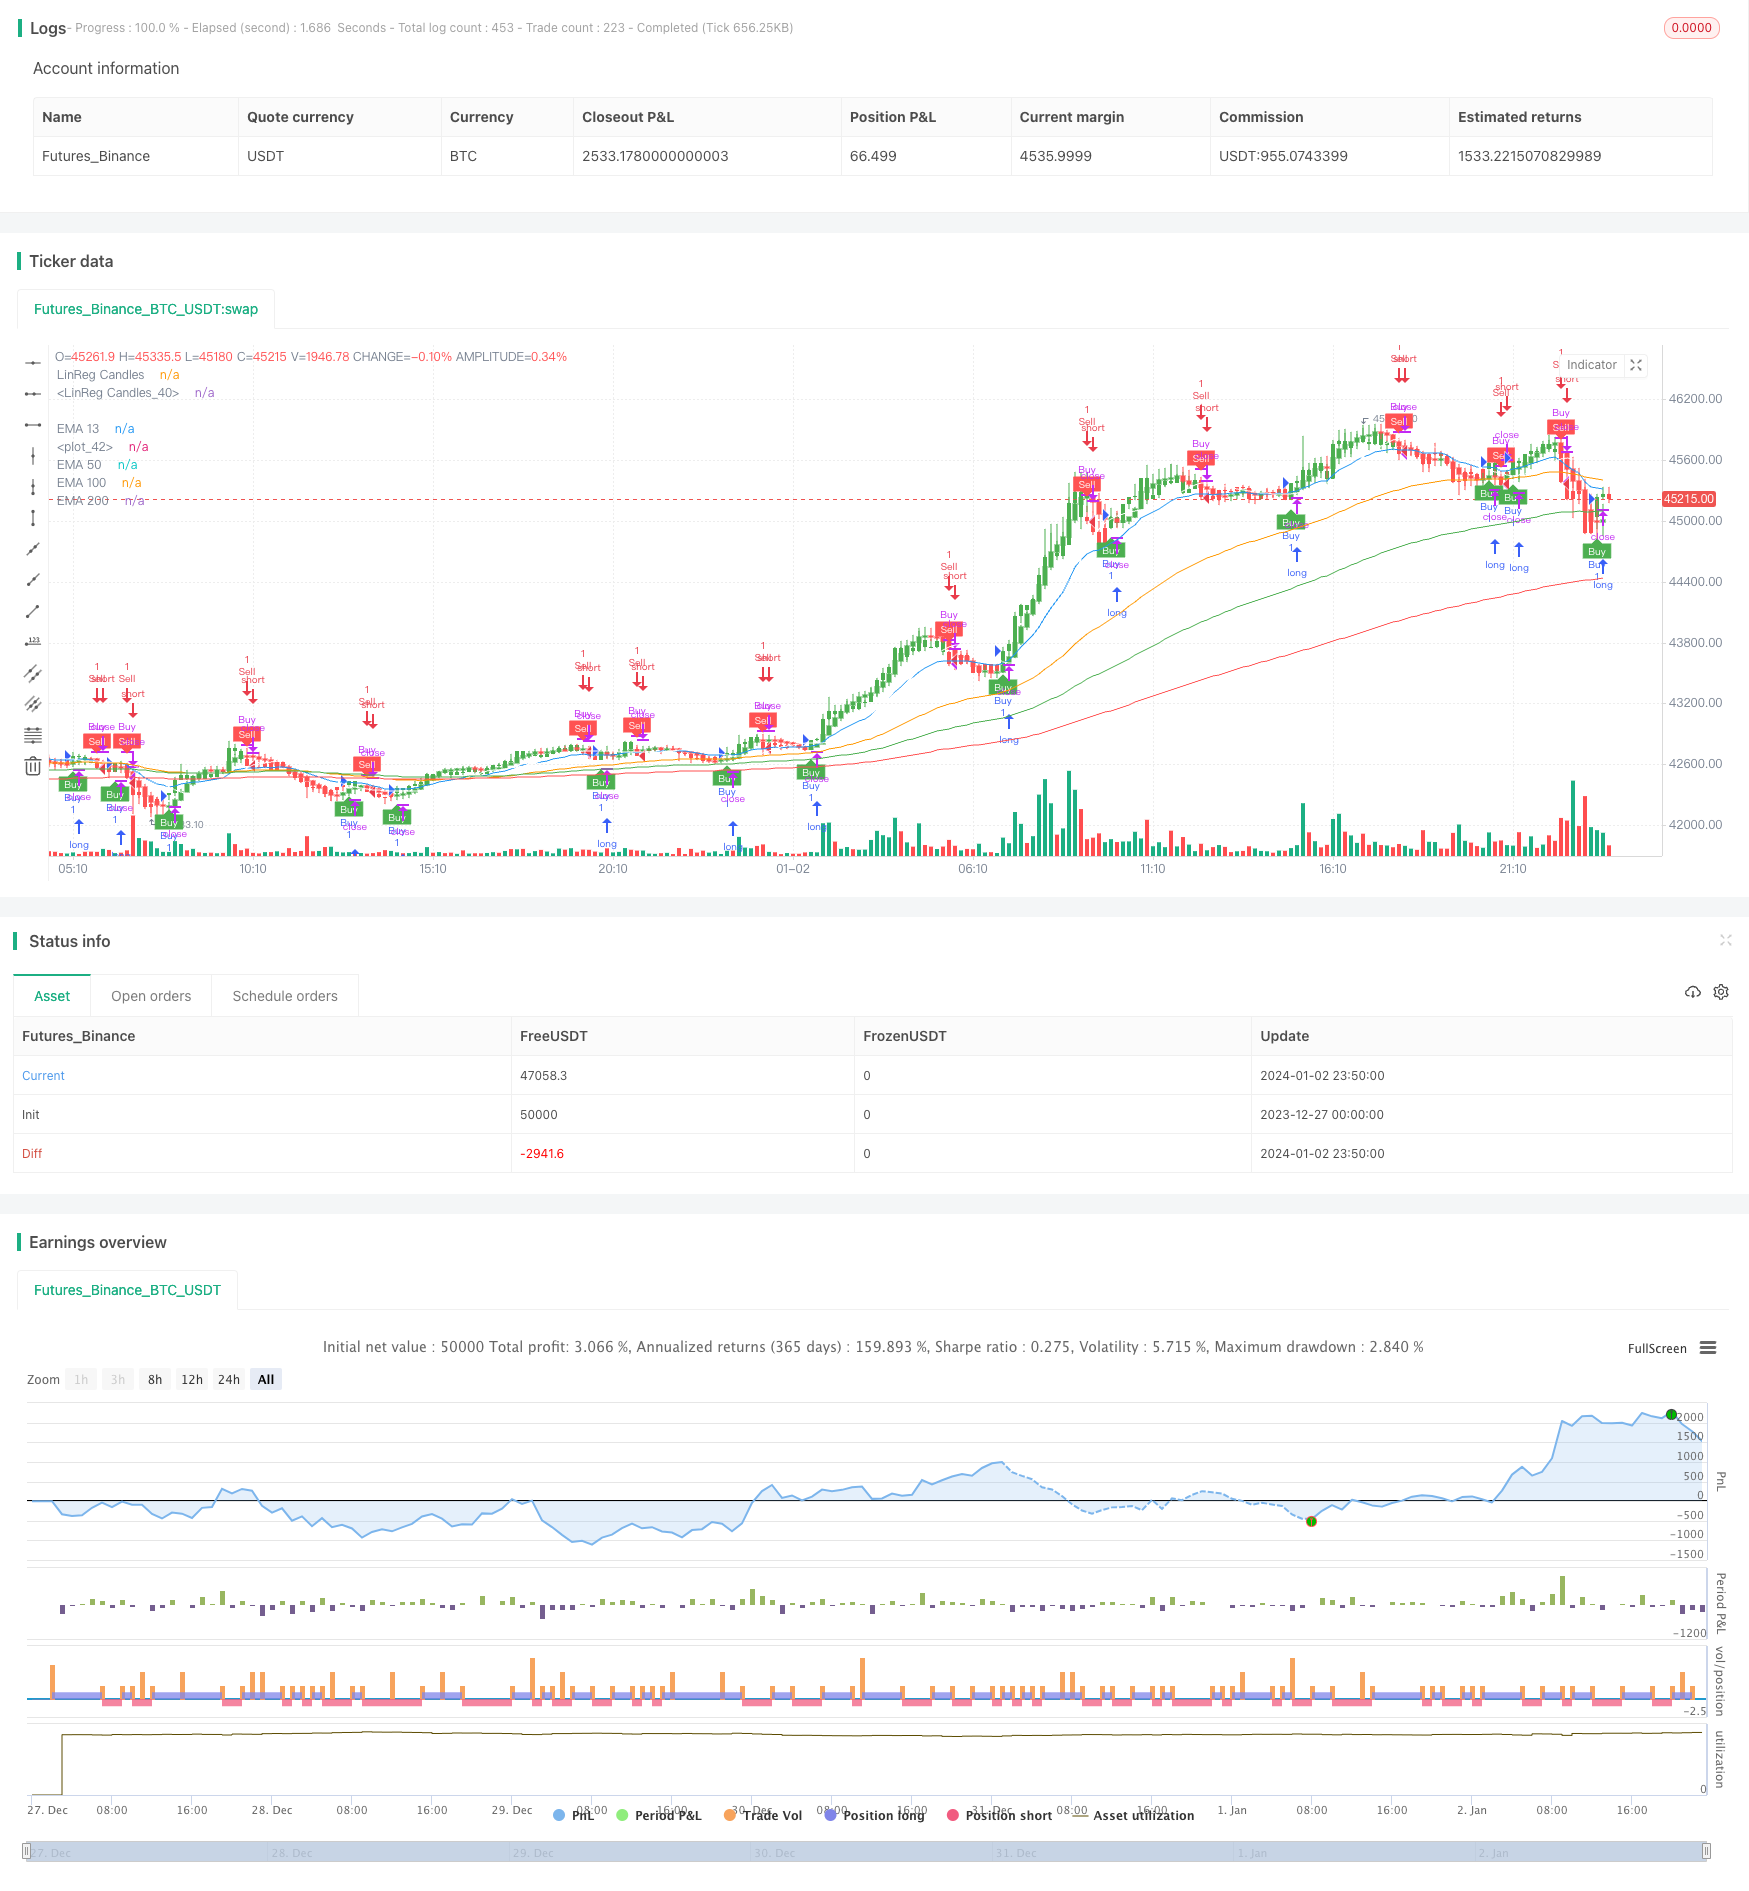
- Excellent drawdown control, max drawdown within 160%.
- Dynamic stop loss smarter than fixed one, can lock in more trend profits.
- Using EMA to determine primary trend avoids reversal trades.
- Smoothed bars filter fake signals and improve win rate.
Risk Analysis
There are also some risks:
- Static parameters may not fit different products, optimization needed.
- Stop loss may gap out in ranging markets.
- Requires server stability to avoid missing signals.
These risks can be reduced via parameter optimization, adaptability testing etc.
Optimization Directions
The strategy can be optimized in the following aspects:
- Automated parameter optimization with machine learning algorithms.
- Add adaptive stop loss based on market conditions.
- Increase compound filters to improve stability.
- Consider cross product testing to improve adaptability.
Conclusions
In summary, this is a quant strategy designed based on trend following concept. It determines trend direction with EMA and uses dynamic ATR stop loss. It can effectively control drawdown while capturing trend profits. Continued optimization and iteration can generate improved results.
/*backtest
start: 2023-12-27 00:00:00
end: 2024-01-03 00:00:00
period: 10m
basePeriod: 1m
exchanges: [{"eid":"Futures_Binance","currency":"BTC_USDT"}]
*/

//@version=4
strategy("Combined Strategy", overlay=true)

// Input variables for EMA Crossover
ema13_length = input(13, title="EMA 13 Length")
ema50_length = input(50, title="EMA 50 Length")
ema100_length = input(100, title="EMA 100 Length")
ema200_length = input(200, title="EMA 200 Length")

// Calculate EMAs for EMA Crossover
ema13 = ema(close, ema13_length)
ema50 = ema(close, ema50_length)
ema100 = ema(close, ema100_length)
ema200 = ema(close, ema200_length)

// Plot EMAs for EMA Crossover
plot(ema13, color=color.blue, title="EMA 13")
plot(ema50, color=color.orange, title="EMA 50")
plot(ema100, color=color.green, title="EMA 100")
plot(ema200, color=color.red, title="EMA 200")

// Input variables for LinReg Candles
signal_length = input(title="Signal Smoothing", type=input.integer, minval=1, maxval=200, defval=11)
sma_signal = input(title="Simple MA (Signal Line)", type=input.bool, defval=true)

lin_reg = input(title="Lin Reg", type=input.bool, defval=true)
linreg_length = input(title="Linear Regression Length", type=input.integer, minval=1, maxval=200, defval=11)

// Calculate LinReg Candles
bopen = lin_reg ? linreg(open, linreg_length, 0) : open
bhigh = lin_reg ? linreg(high, linreg_length, 0) : high
blow = lin_reg ? linreg(low, linreg_length, 0) : low
bclose = lin_reg ? linreg(close, linreg_length, 0) : close

r = bopen < bclose

signal = sma_signal ? sma(bclose, signal_length) : ema(bclose, signal_length)

plotcandle(r ? bopen : na, r ? bhigh : na, r ? blow: na, r ? bclose : na, title="LinReg Candles", color=color.green, wickcolor=color.green, bordercolor=color.green, editable=true)
plotcandle(r ? na : bopen, r ? na : bhigh, r ? na : blow, r ? na : bclose, title="LinReg Candles", color=color.red, wickcolor=color.red, bordercolor=color.red, editable=true)

plot(signal, color=color.white)

// Input variables for UT Bot Alerts
a = input(1, title="Key Value. 'This changes the sensitivity'")
c = input(10, title="ATR Period")
h = input(false, title="Signals from Heikin Ashi Candles")

// Calculate UT Bot Alerts
xATR = atr(c)
nLoss = a * xATR

src = h ? security(heikinashi(syminfo.tickerid), timeframe.period, close, lookahead=false) : close

xATRTrailingStop = 0.0
xATRTrailingStop := iff(src > nz(xATRTrailingStop[1], 0) and src[1] > nz(xATRTrailingStop[1], 0), max(nz(xATRTrailingStop[1]), src - nLoss),
   iff(src < nz(xATRTrailingStop[1], 0) and src[1] < nz(xATRTrailingStop[1], 0), min(nz(xATRTrailingStop[1]), src + nLoss),
   iff(src > nz(xATRTrailingStop[1], 0), src - nLoss, src + nLoss)))

pos = 0
pos := iff(src[1] < nz(xATRTrailingStop[1], 0) and src > nz(xATRTrailingStop[1], 0), 1,
   iff(src[1] > nz(xATRTrailingStop[1], 0) and src < nz(xATRTrailingStop[1], 0), -1, nz(pos[1], 0)))

xcolor = pos == -1 ? color.red: pos == 1 ? color.green : color.blue

ema = ema(src,1)
above = crossover(ema, xATRTrailingStop)
below = crossover(xATRTrailingStop, ema)

buy = src > xATRTrailingStop and above
sell = src < xATRTrailingStop and below

barbuy = src > xATRTrailingStop
barsell = src < xATRTrailingStop

strategy.entry("Buy", strategy.long, when=buy)
strategy.close("Buy", when=sell)
strategy.entry("Sell", strategy.short, when=sell)
strategy.close("Sell", when=buy)

plotshape(buy, title="Buy", text='Buy', style=shape.labelup, location=location.belowbar, color=color.green, textcolor=color.white, transp=0, size=size.tiny)
plotshape(sell, title="Sell", text='Sell', style=shape.labeldown, location=location.abovebar, color=color.red, textcolor=color.white, transp=0, size=size.tiny)

barcolor(barbuy ? color.green : na)
barcolor(barsell ? color.red : na)

alertcondition(buy, "UT Long", "UT Long")
alertcondition(sell, "UT Short", "UT Short")