Trend Following Strategy Based on EMA and MACD across Timeframes

Overview
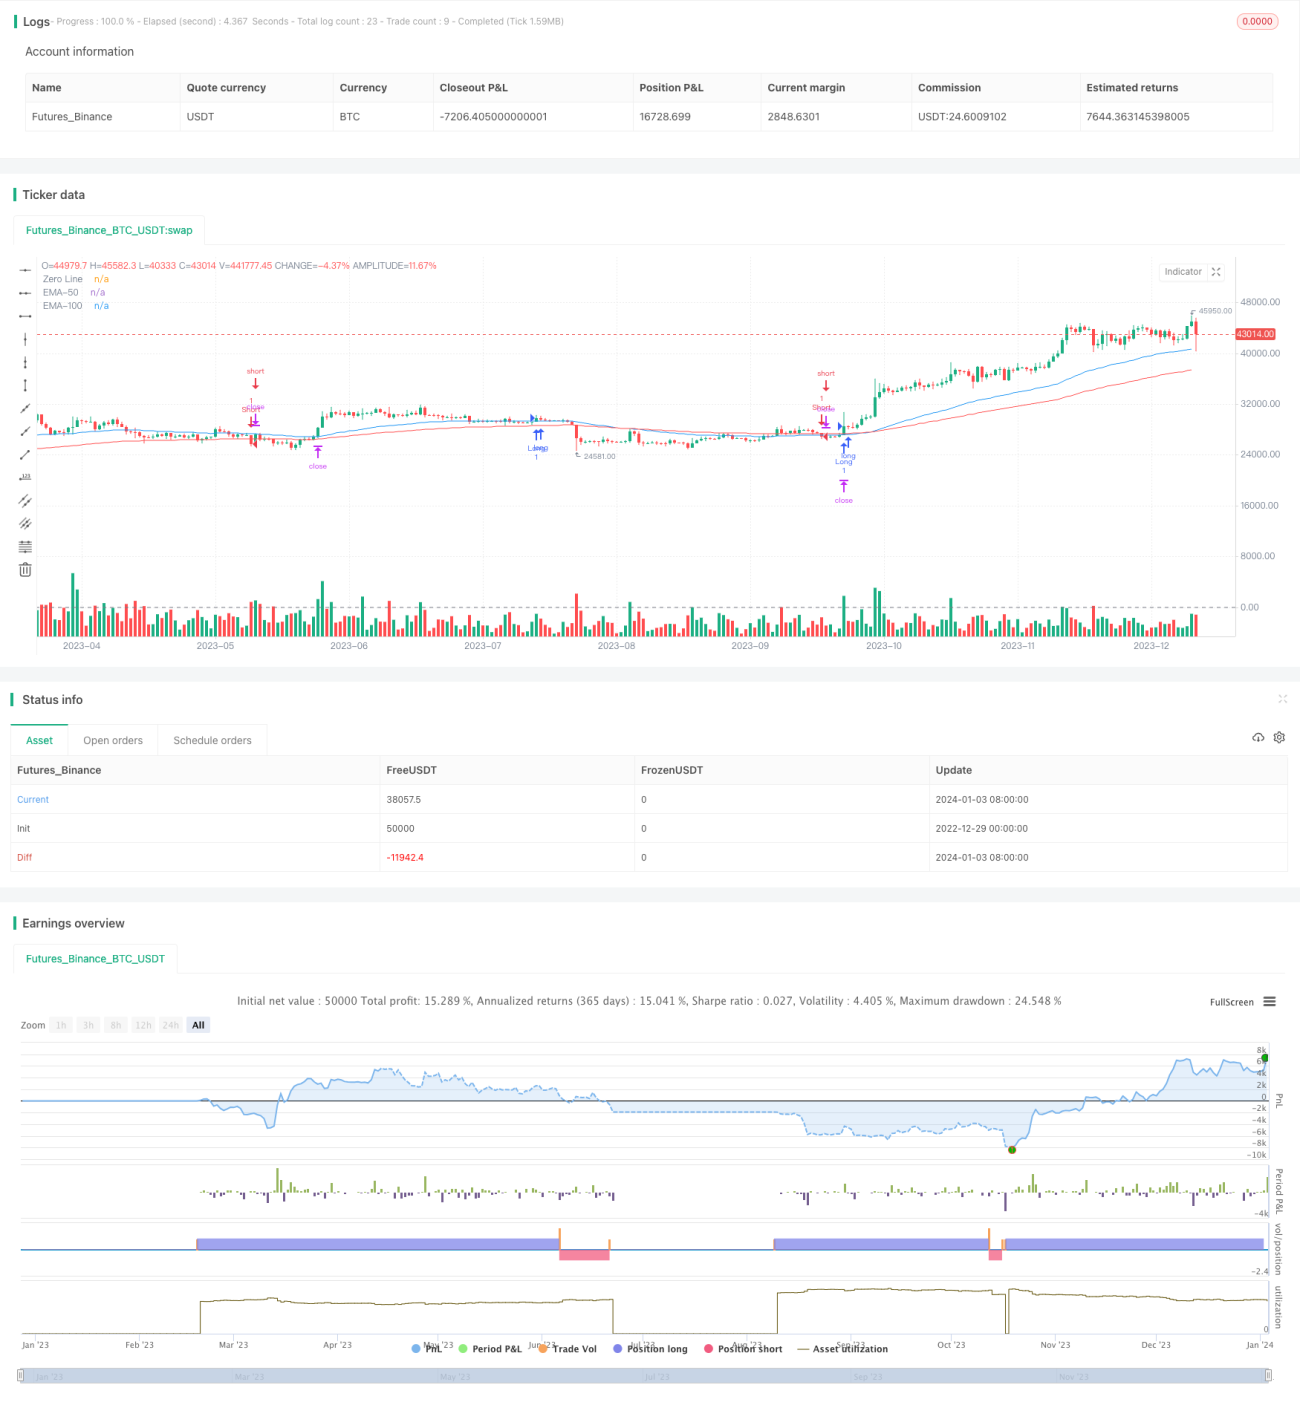
This strategy combines EMA lines and MACD indicator across timeframes to identify trend signals and capture mid-to-long term trends. It takes trend following actions when short-term trend aligns with mid-to-long term trend. Meanwhile, the strategy uses ATR indicator to set stop loss and take profit to control risks from fluctuations.
Principles
The strategy uses 50-day EMA and 100-day EMA to determine mid-to-long term trend direction. When short-term trend is identified by MACD indicator, it checks if the directions align. If yes, it takes trend following actions.
Specifically, when MACD fast line crosses above slow line, and closes > 50-day EMA and closes > 100-day EMA, it goes long. When MACD fast line crosses below slow line, and closes < 50-day EMA and closes < 100-day EMA, it goes short.
Also, the strategy uses ATR indicator to calculate range of fluctuations and set stop loss and take profit prices. It sets certain multiplier of ATR based on close price as stop loss level, and certain multiplier of ATR based on close price as take profit level.
Advantage Analysis
-
Combining EMA lines and MACD indicator across timeframes helps identify trend signals and prevents missing mid-to-long term trends
-
Using ATR indicator to set stop loss and take profit based on market fluctuation effectively controls risks
-
Avoiding market neutral zones prevents unnecessary losses
Risk Analysis
-
EMA lines have lagging effect and may miss turning points
-
MACD indicator has multiple timeframes and parameter settings that impact results
-
ATR ranges cannot fully represent future price fluctuations, cannot eliminate risks
Counter measures:
-
Confirm signals with other indicators to avoid EMA lagging issues
-
Adjust MACD parameters and optimize results
-
Reasonably set ATR multiplier to control maximum loss
Optimization Directions
-
Test different combinations of EMA line periods
-
Optimize MACD parameter settings
-
Use machine learning methods to automatically find optimal ATR stop loss/take profit multipliers
Summary
The strategy combines EMA, MACD and ATR indicators to implement trend following operations across timeframes. Through parameter optimization, it has the potential to achieve good strategy return rates. Also need to prevent risks including indicator lagging, improper parameter adjustment and fluctuation control, and continue to optimize and enhance.
- 1