Momentum Oscillating Moving Average Trading Strategy Based on Buffered Bollinger Bands

Overview
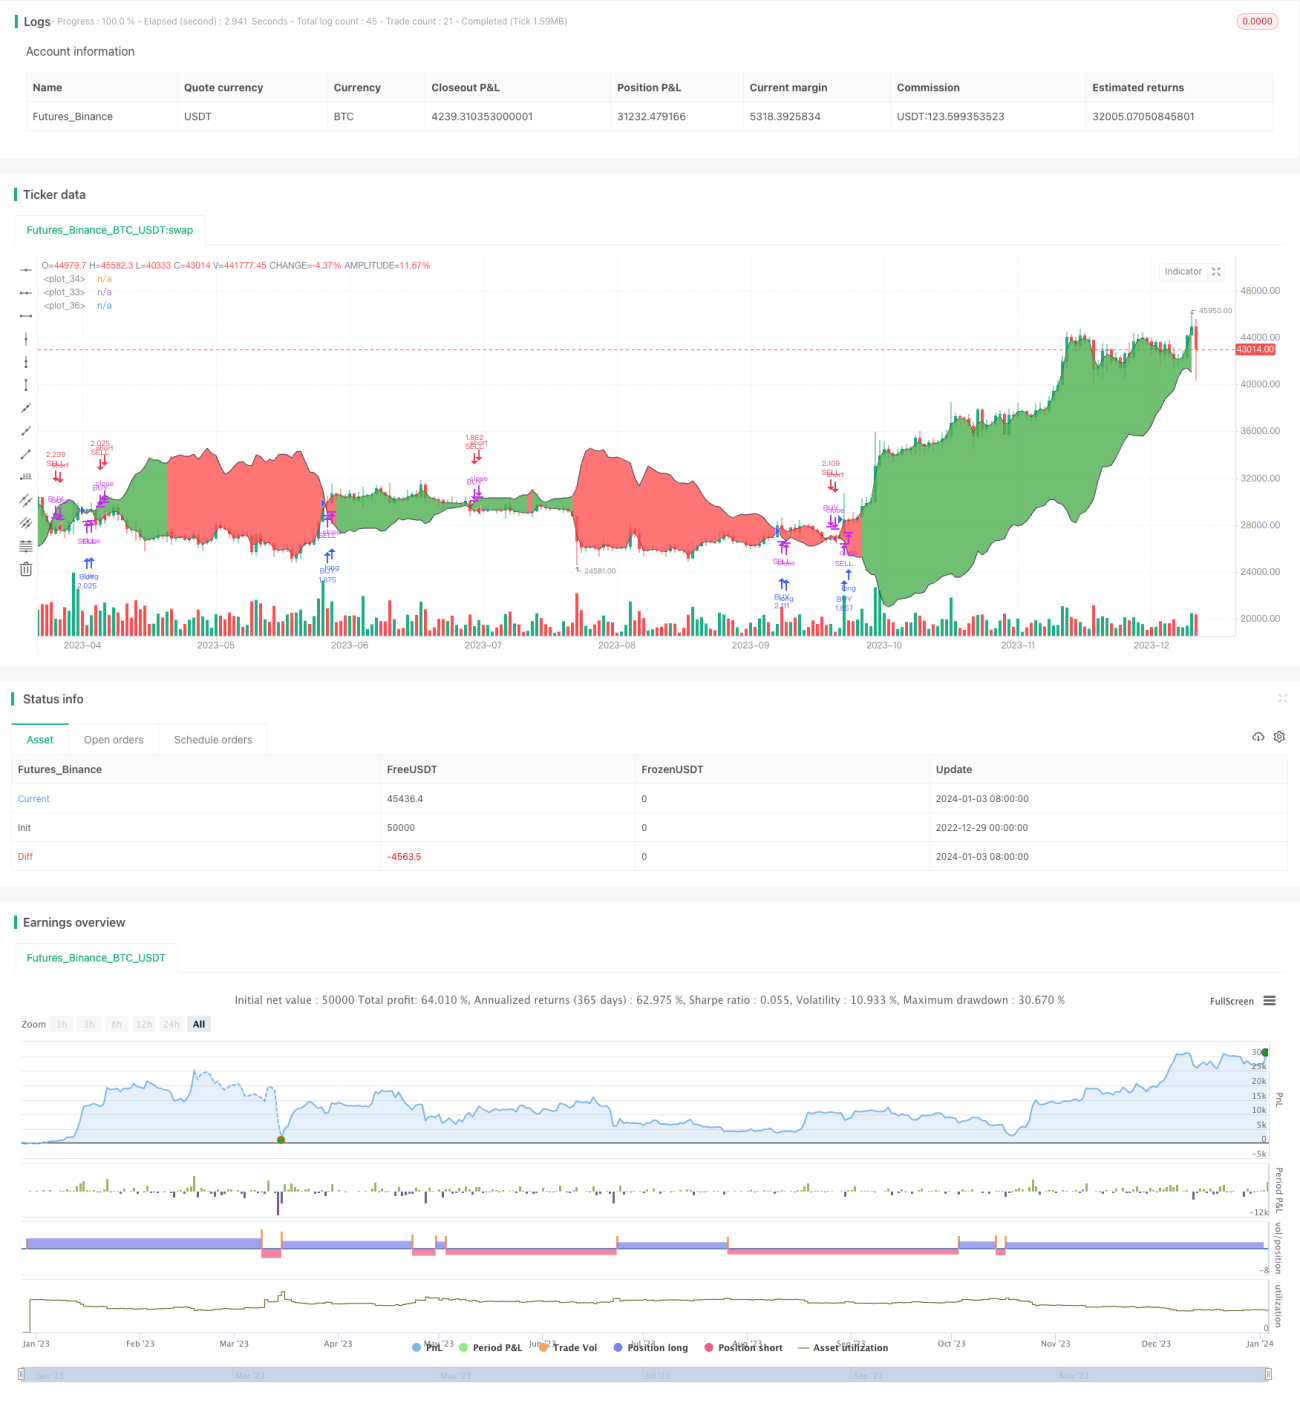
This strategy constructs a price channel based on the Bollinger Bands indicator and the Momentum Oscillating Moving Average indicator, generating trading signals when the price breaks through the upper or lower boundary of the channel. By combining the adaptability of Bollinger Bands and the flexibility of momentum oscillators, it can respond timely to changes in market trends.
Strategy Logic
The strategy builds a price channel using the Bollinger middle band and the Momentum Oscillating Moving Average. The middle band adopts 21-period Bollinger middle band. The upper and lower bands stretch up and down for a percentage range respectively. The Momentum Oscillating Moving Average stretches or shrinks near overbought or oversold levels based on the middle band. When price breaks through the upper band, go long. When price breaks through the lower band, go short.
Specifically, the Bollinger middle band is calculated as:
Middle Band = Moving Average of N-period closing price
The upper band and lower band are calculated as:
Upper Band = Middle Band + WidthDev * N-period Bollinger standard deviation
Lower Band = Middle Band - WidthDev * N-period Bollinger standard deviation
Where WidthDev represents the extended percentage range up and down.
The Momentum Oscillating Moving Average stretches or shrinks based on the middle band according to certain rules. When the market becomes overbought or oversold, it extends further away from the middle band to provide more opportunities for going long or going short. When the market calms down, it contracts towards the middle band.
In summary, this strategy depicts a price channel using Bollinger Bands and determines entry timing using the Momentum Oscillating Moving Average, realizing breakout trading. Go long when price breaks out upwards from the Bollinger upper band, and go short when price breaks out downwards from the Bollinger lower band.
Advantage Analysis
-
Reflects market volatility
Bollinger Bands can reflect market volatility and changing trends in real time. The upper and lower bands adapt based on changes in volatility. -
Reduces false signals
The stretching effect of the Momentum Oscillating Moving Average can effectively reduce false signals generated by Bollinger Bands. By expanding the width of the BB channel and extending holding periods, greater profits can be obtained. -
Timely catches trend reversal
The crossover of BB upper & lower bands and Momentum Oscillating Moving Average provides advantageous timing and pricing for generating trading signals, which can effectively catch key bull and bear adjustments and timely grasp trend reversals.
Risk Analysis
-
Improper BB parameters
Improper settings of BB parameters like calculation period and standard deviation multiplier may lead to too wide or too narrow spacing between the bands, generating excessive false signals and undermining the stability of the strategy. -
Excessive oscillation amplitude
Excessively large oscillation amplitude of the Momentum Oscillating Moving Average may result in stop loss points being too distant, increasing loss risk. -
Delayed reversal
When the market is oscillating or trendless, trading signals from BB and Momentum Oscillating Moving Average may lag, failing to reflect price changes in time, causing delayed reversal risk.
Optimization Directions
-
Optimize BB parameters
Test different periods, standard deviation multipliers to find optimal parameter combinations that provide better signal frequency and fewer false signals. -
Optimize Momentum Oscillating Moving Average parameters
Test different oscillation amplitudes and periods to find parameters that better catch trends and reduce signal lag. -
Add filter conditions
Add filters like trading volumes based on crossover signals to exclude inefficient trade signals. -
Strategy combination
Combine this strategy with other stop loss strategies or machine learning strategies to further control risks and improve stability.
Summary
This strategy combines the strengths of adaptive Bollinger Bands and Momentum Oscillating Moving Average, achieving an integration of trend following and catching trend reversals. By balancing market volatility and trading signal flexibility, it realizes stable and effective breakout trading. Parameter optimization and risk control are also critical to test and tune according to varying market environments.
/*backtest
start: 2022-12-29 00:00:00
end: 2024-01-04 00:00:00
period: 1d
basePeriod: 1h
exchanges: [{"eid":"Futures_Binance","currency":"BTC_USDT"}]
*/

//@version=3
//                               Hull Cloud v2 by SEASIDE420
strategy("Hull Moving Average Cloud v2", shorttitle="hull_cloud_v2", overlay=true, commission_type=strategy.commission.percent, commission_value=0.075, default_qty_type=strategy.percent_of_equity, max_bars_back=200, default_qty_value=100, calc_on_order_fills= true, calc_on_every_tick=true, pyramiding=0)
hullperiod=input(title="HullMA Period",defval=210, minval=1)- 1