Visual Comparison between Strategy and Buy & Hold Returns

Overview
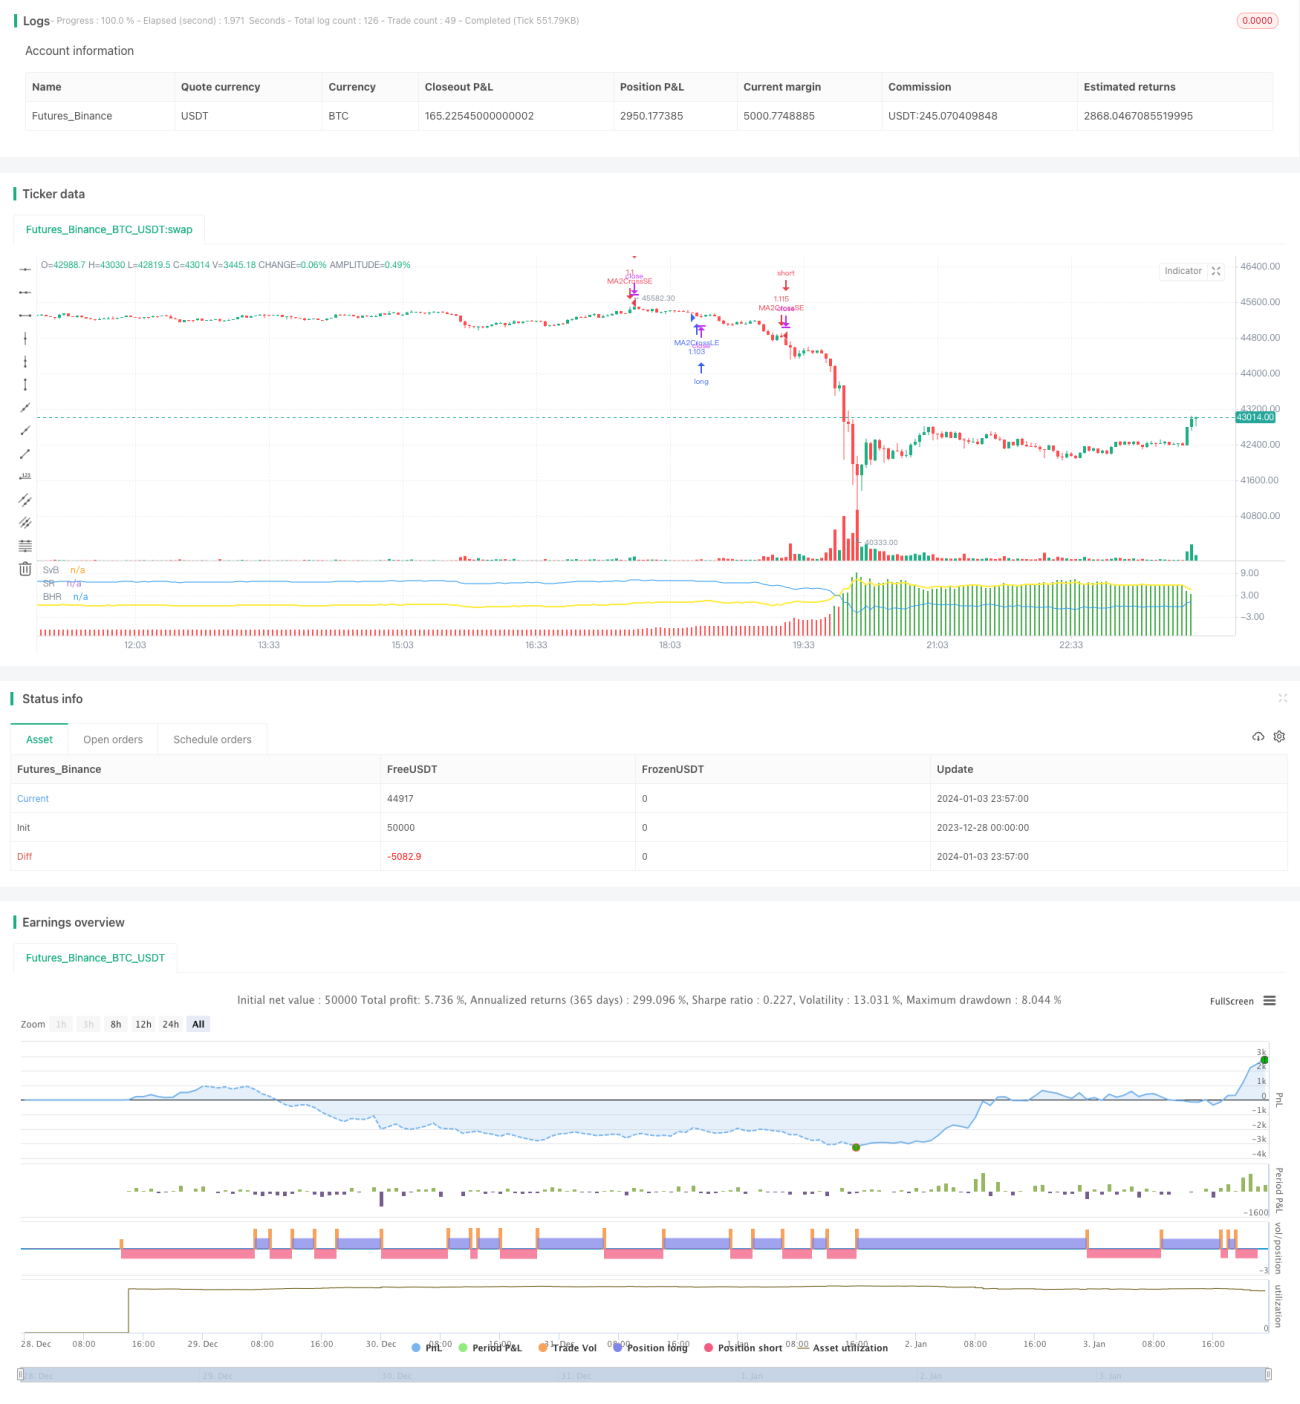
This strategy makes a detailed and visual comparison between a given strategy and the buy & hold returns of the traded security.
Strategy Logic
The core logic of this strategy is to plot four key elements for comparison between the given strategy and buy & hold strategy:
- Strategy P/L: strategy net profit + strategy open profit
- Buy & Hold P/L: unrealized return
- Difference: Strategy P/L - Buy & Hold P/L
- Strategy vs Buy Hold Stats
- Percent of bars strategy P/L is above Buy & Hold
- Percent of bars strategy P/L is below Buy & Hold
- All Time Average Difference
By comparing the above four elements, we can have an intuitive understanding on whether our strategy outperforms or underperforms a simple buy & hold strategy.
Advantage Analysis
Compared with a simple comparison of buy & hold returns, this strategy has the following advantages:
-
More comprehensive and detailed comparison metrics, including per bar comparisons and overall statistical comparisons, so that we know clearly when and where our strategy beats or loses to buy & hold.
-
Intuitive visual charts that plot the strategy P/L, buy & hold P/L and the difference between them. It allows us to visually tell the performance of our strategy faster.
-
Customizable comparison date range where we can focus on comparing our strategy vs buy & hold on specific periods.
-
Simple and easy to use. The comparison logic is built-in so that we only need to replace the strategy script section with our own. No need to code the comparison logic ourselves.
Risk Analysis
This strategy relies mainly on the built-in buy & hold return metrics of the trading platform for comparison. Any bias with that benchmark will affect the final result. Also, there may exist flaws in the statistical calculations of this strategy that fail to accurately reflect the comparison.
More benchmarks and statistical methods can be introduced for further validation. If the trading platform introduces significant changes to the buy & hold metric, the comparison logic here needs to be adjusted as well.
Optimization Directions
This strategy can be further optimized from the following aspects:
-
Introduce more benchmarks for 3-way or multi-way comparison, e.g. comparing against an index or industry peers.
-
Include more statistical metrics like annual win rate, maximum drawdown duration difference etc. for assessing the strategy from more dimensions.
-
Make more components like benchmarks, metrics etc customizable by users instead of just the date range.
-
Improve charting visualization since simple line charts here make it hard to spot detailed comparisons on specific bars. Column plots or additional markings can help.
Conclusion
With detailed comparison metrics and intuitive visual charts, this strategy allows us to have a very clear view on where and how our custom strategy differs from a simple buy & hold approach. The customizable date range also provides flexibility in analyzing the pros & cons of our strategy in different periods.
Further enriching the benchmarks, metrics and visualizations can turn this into an extremely powerful toolkit for strategy analysis. It provides a template and framework for making strategy analysis and enhancements much more efficient.
- 1