MACD Crossover Trading Strategy

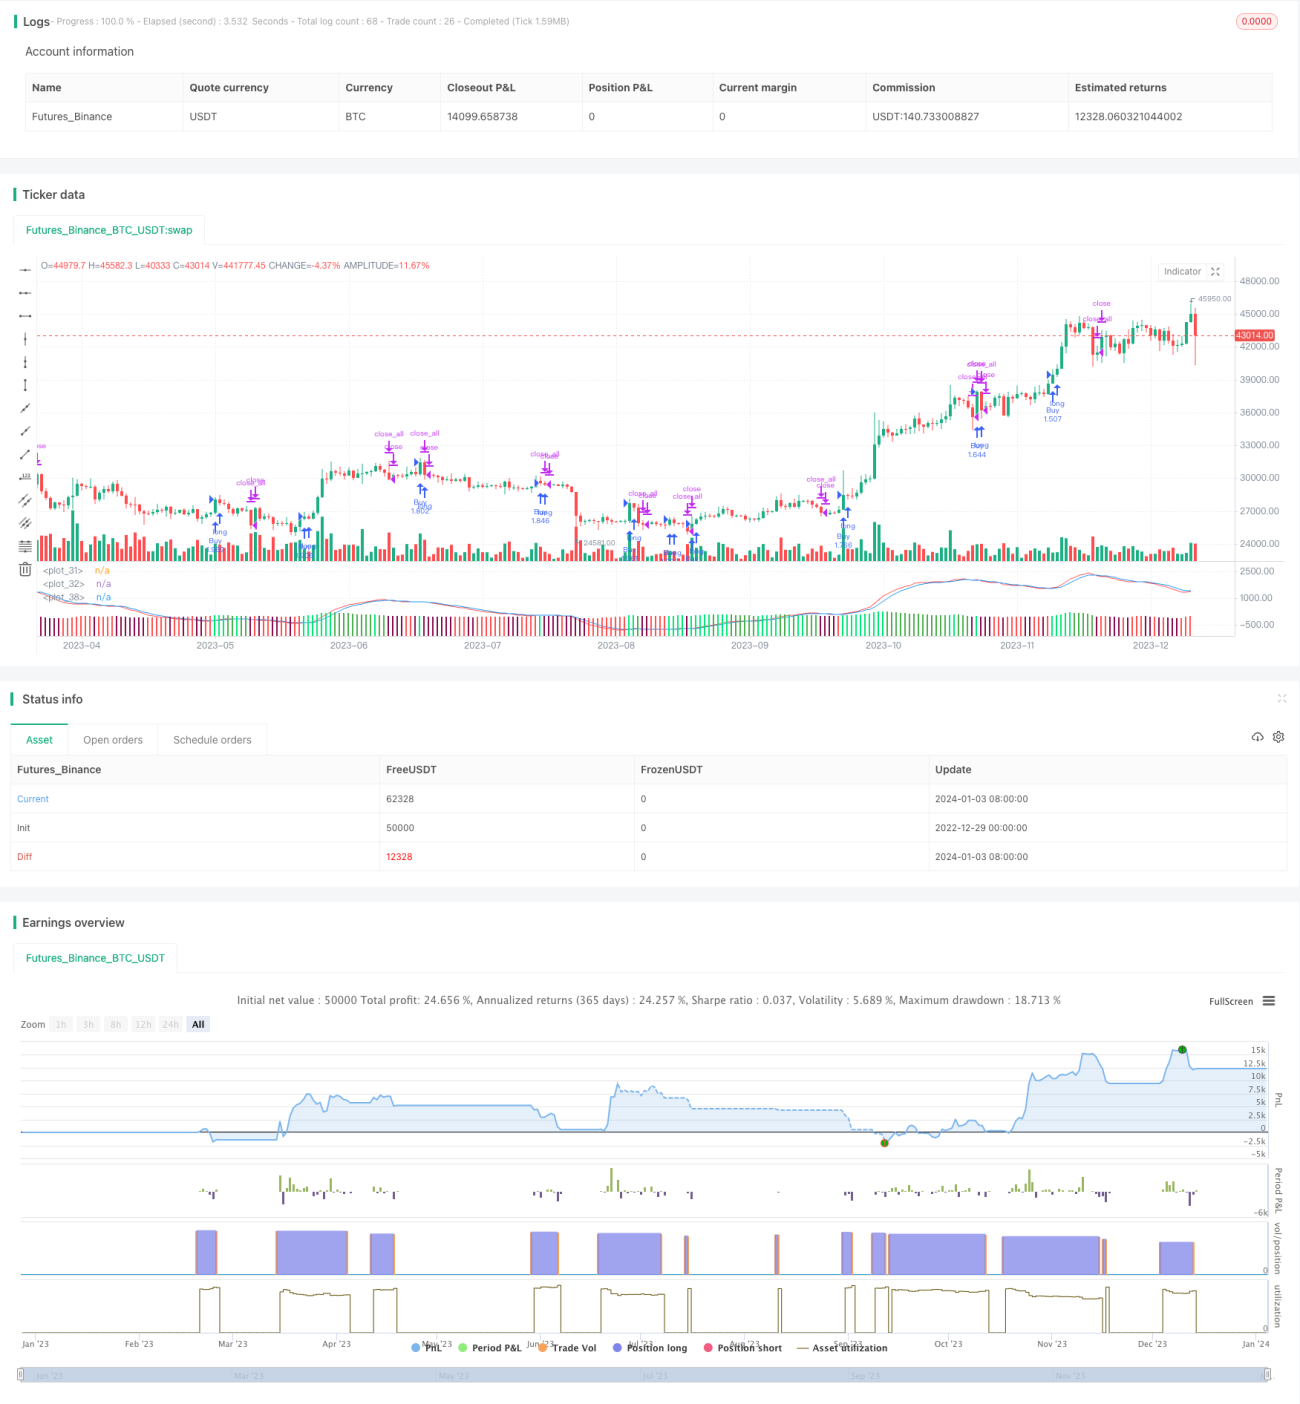
Overview
The MACD crossover trading strategy is a trend-following strategy. It uses the crossover of fast and slow moving average lines as buy and sell signals. When the fast moving average line crosses above the slow moving average line, a buy signal is generated. When the fast moving average line crosses below the slow moving average line, a sell signal is generated.
Strategy Principle
This strategy is based on the MACD indicator. The MACD indicator is the difference between two moving average lines with different parameters, reflecting the changes in the momentum of prices. Specifically, it is the difference between the fast moving average line (default parameter is 12-day line) and the slow moving average line (default parameter is 26-day line), called the MACD bar. To eliminate oscillations, the MACD indicator also introduces a DEA line or signal line, usually the 9-day weighted moving average of the MACD.
When the MACD bar breaks through the DEA line from bottom up and enters the positive area, it indicates that the short-term average line crosses above the long-term average line, indicating that the price trend turns to upward and a buy signal is generated. When the MACD falls from top to bottom through the DEA line and enters the negative area, it indicates that the short-term average line crosses below the long-term average line and the price trend turns to downward, generating a sell signal.
The strategy uses the crossover of the MACD bar and the DEA line to determine the timing of buying and selling. It buys when the MACD bar crosses above the DEA line and sells when the MACD bar crosses below the DEA line.
Advantage Analysis
The advantages of this strategy include:
- Ability to follow the trend and capture price changes in a timely manner.
- Simple and easy to understand and implement.
- Relatively fixed parameters without frequent adjustment.
- Applicable to different timeframes.
Risk Analysis
This strategy also has some risks:
- May generate multiple false signals or whipsaws in sideways markets.
- Has some lag and may miss the best timing of price changes.
- Parameters are easily overoptimized and actual results may be poor.
To reduce risks, parameters can be adjusted, or combined with other indicators like volume and volatility indicators. In addition, proper stop loss and take profit strategies are also important.
Optimization Directions
This strategy can be optimized in the following aspects:
-
Parameter optimization to find the optimal parameters while avoiding overoptimization.
-
Combining with other indicators to form more powerful combination strategies.
-
Setting proper stop loss and take profit points to effectively control risks.
-
Adaptive optimization to apply this strategy to different markets and timeframes based on actual conditions.
Conclusion
The MACD crossover trading strategy captures trend changes at a low cost by following price trends. It is simple, practical and easy to implement, making it a suitable starter strategy for beginners. But this strategy also has some flaws. By constantly optimizing and improving, the actual effect of this strategy can be better. It is worth recommending.
/*backtest
start: 2022-12-29 00:00:00
end: 2024-01-04 00:00:00
period: 1d
basePeriod: 1h
exchanges: [{"eid":"Futures_Binance","currency":"BTC_USDT"}]
*/

//@version=3
strategy("MACD Strategy by Forbes",default_qty_type=strategy.percent_of_equity, default_qty_value=100, overlay=false)

fastLength = input(20)- 1