Overview
This is a trend tracking strategy based on Average True Range (ATR). It uses ATR to calculate indicator values and determine price trend direction. The strategy also provides a stop loss mechanism to control risks.
Strategy Logic
The strategy uses three main parameters: Period, Multiplier and Entry/Exit Point. The default parameters are 14 periods of ATR and a multiplier of 4.
The strategy first calculates the long average price (buyavg) and short average price (sellavg), then compares the price relationship between these two averages to determine the current trend direction. If the price is higher than the short average price, it is judged as long; if the price is lower than the long average price, it is judged as short.
In addition, the strategy incorporates ATR to set a trailing stop loss. Specifically, it uses the 14-period weighted moving average of ATR multiplied by a multiplier (default 4) as the stop loss distance. This allows the stop loss distance to be adjusted based on market volatility.
When the stop loss is triggered, the strategy will close the position to lock in profits.
Advantages
- Based on trend judgment, it can follow the trend continuously for profit
- Use ATR to dynamically adjust stop loss distance, effectively control risks
- Simple and direct to calculate entry and exit points, easy to understand and implement
Risks & Solutions
- May encounter large losses when trend changes
- Adjust ATR period and multiplier reasonably to optimize stop loss distance
- WILL generate multiple small losses in ranging markets
- Add filter conditions to avoid ranging markets
- Improper parameter settings may worsen strategy performance
- Conduct multi-parameter optimization to find optimum
Optimization Directions
- Add other indicators for filtering to avoid opening positions in ranging markets
- Optimize ATR period and multiplier parameters to make stop distance more reasonable
- Add position sizing control based on market conditions
Conclusion
Overall this is a simple and practical trend tracking strategy. It only needs a few parameters to implement, and uses ATR to dynamically adjust stops to effectively control risks. When combined with other assisting indicators for filtering, it can be further optimized. In general, this strategy suits those who want to learn about trend tracking strategies, and can also be used as a basic component for more advanced strategies.
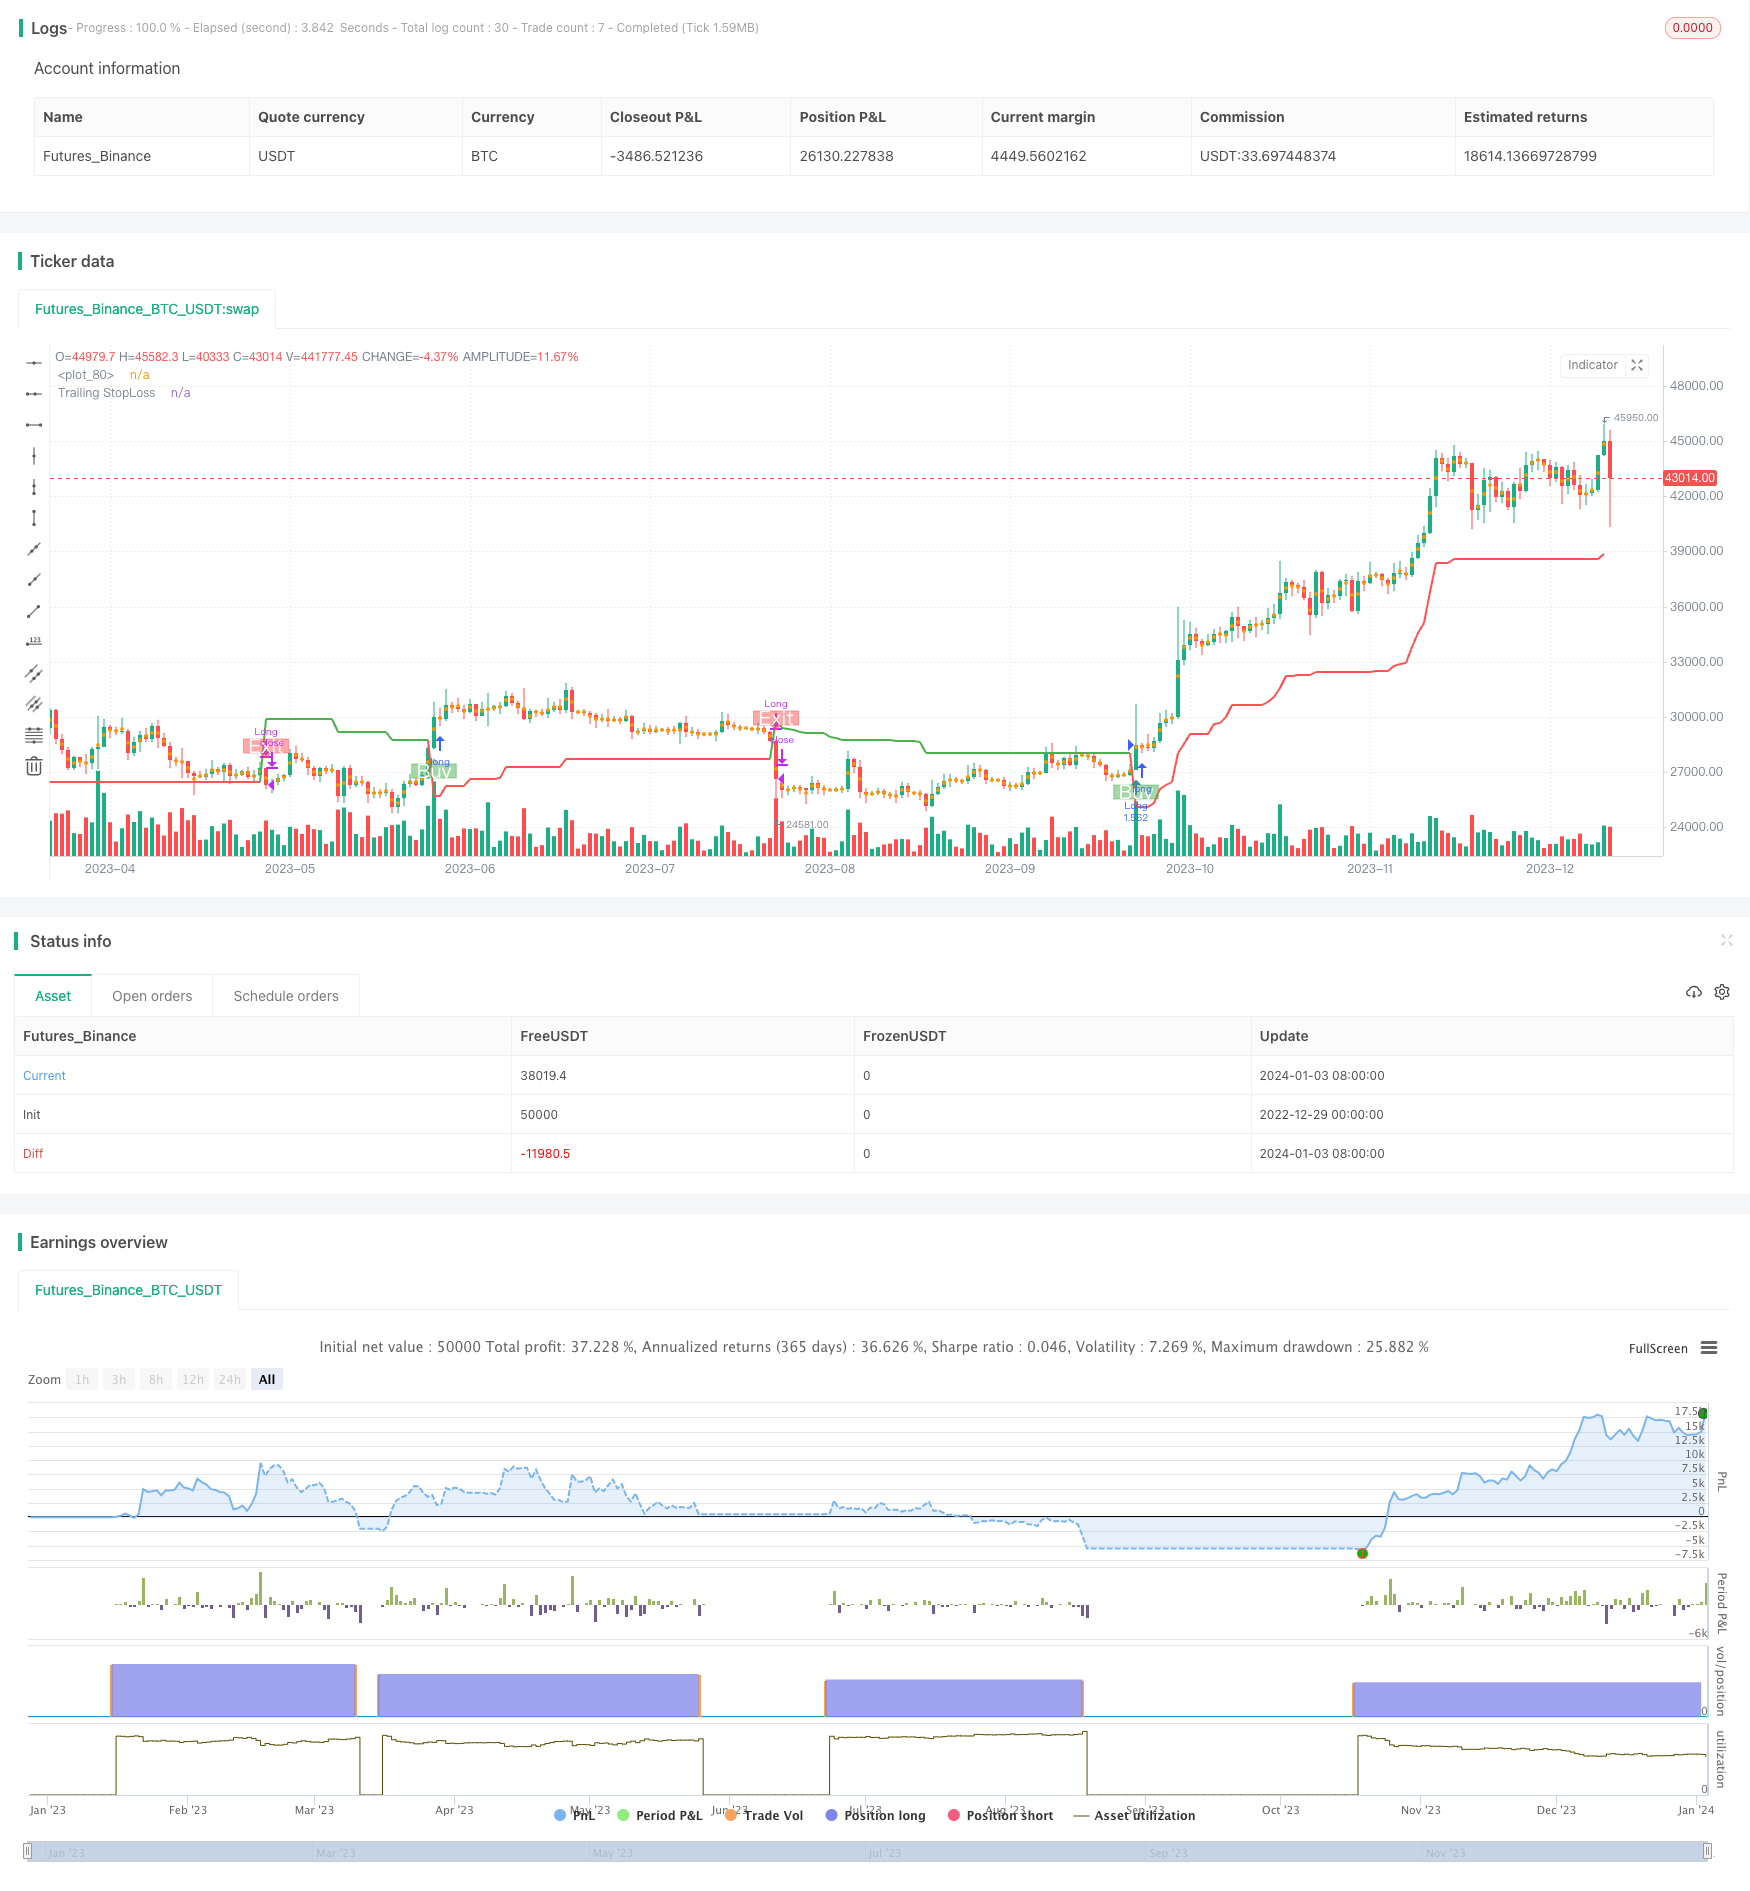
/*backtest
start: 2022-12-29 00:00:00
end: 2024-01-04 00:00:00
period: 1d
basePeriod: 1h
exchanges: [{"eid":"Futures_Binance","currency":"BTC_USDT"}]
*/

//@version=5
strategy('Trend Strategy by zdmre', shorttitle='Trend Strategy', overlay=true, pyramiding=0, currency=currency.USD, default_qty_type=strategy.percent_of_equity, initial_capital=10000, default_qty_value=100, commission_type=strategy.commission.percent, commission_value=0.005)
show_STOPLOSSprice = input(true, title='Show TrailingSTOP Prices')
src = input(close, title='Source')
out2 = ta.ema(src, 20)

buyavg = (close + high) / 2.02 - high * (1 - open / close) * (1 - low * open / (high * close))
sellavg = ((low + close) / 1.99 + low * (1 - low / open) * (1 - low * open / (close * high)) / 1.1 + out2 )/ 2

// === INPUT BACKTEST RANGE ===
fromMonth = input.int(defval=1, title='From Month', minval=1, maxval=12)
fromDay = input.int(defval=1, title='From Day', minval=1, maxval=31)
fromYear = input.int(defval=2021, title='From Year', minval=1970)
thruMonth = input.int(defval=1, title='Thru Month', minval=1, maxval=12)
thruDay = input.int(defval=1, title='Thru Day', minval=1, maxval=31)
thruYear = input.int(defval=2100, title='Thru Year', minval=1970)

// === INPUT SHOW PLOT ===
showDate = input(defval=true, title='Show Date Range')

// === FUNCTION EXAMPLE ===
start = timestamp(fromYear, fromMonth, fromDay, 00, 00)  // backtest start window
finish = timestamp(thruYear, thruMonth, thruDay, 23, 59)  // backtest finish window
window() => true


// === TRAILING STOP LOSS === //

ATR_Period = input(14)
ATR_Mult = input(4.0)
var float ATR_TrailSL = na
var int pos = na
atr = ta.rma (ta.tr(true), 14)
xATR = ta.atr(ATR_Period)
nLoss = ATR_Mult * xATR

iff_1 = close > nz(ATR_TrailSL[1], 0) ? close - nLoss : close + nLoss
iff_2 = close < nz(ATR_TrailSL[1], 0) and close[1] < nz(ATR_TrailSL[1], 0) ? math.min(nz(ATR_TrailSL[1]), close + nLoss) : iff_1
ATR_TrailSL := close > nz(ATR_TrailSL[1], 0) and close[1] > nz(ATR_TrailSL[1], 0) ? math.max(nz(ATR_TrailSL[1]), close - nLoss) : iff_2

iff_3 = close[1] > nz(ATR_TrailSL[1], 0) and close < nz(ATR_TrailSL[1], 0) ? -1 : nz(pos[1], 0)
pos := close[1] < nz(ATR_TrailSL[1], 0) and close > nz(ATR_TrailSL[1], 0) ? 1 : iff_3

atr_color = pos == -1 ? color.green : pos == 1 ? color.red : color.aqua
atrtrend = plot(ATR_TrailSL, 'Trailing StopLoss', atr_color, linewidth=2)

// ===  Stop Loss === //
slGroup = 'Stop Loss'
useSL = input.bool(false, title='╔══════   Enable   ══════╗', group=slGroup, tooltip='If you are using this strategy for Scalping or Futures market, we do not recommend using Stop Loss.')
SLbased = input.string(title='Based on', defval='Percent', options=['ATR', 'Percent'], group=slGroup, tooltip='ATR: Average True Range\nPercent: eg. 5%.')
multiATR = input.float(10.0, title='ATR   Mult', group=slGroup, inline='atr')
lengthATR = input.int(14, title='Length', group=slGroup, inline='atr')
SLPercent = input.float(5, title='Percent', group=slGroup) * 0.01
Shortposenter = input.bool(false, title='ShortPosition')

longStop = 0.0
shortStop = 0.0

if SLbased == 'ATR'
    longStop := ta.valuewhen(pos == 1, low, 0) - ta.valuewhen(pos == 1, ta.rma(ta.tr(true), lengthATR), 0) * multiATR
    longStopPrev = nz(longStop[1], longStop)
    longStop := close[1] > longStopPrev ? math.max(longStop, longStopPrev) : longStop

    shortStop := ta.valuewhen(pos == -1, ta.rma(ta.tr(true), lengthATR), 0) * multiATR + ta.valuewhen(pos == -1, high, 0)
    shortStopPrev = nz(shortStop[1], shortStop)
    shortStop := close[1] > shortStopPrev ? math.max(shortStop, shortStopPrev) : shortStop
    shortStop
if SLbased == 'Percent'
    longStop := strategy.position_avg_price * (1 - SLPercent)
    shortStop := strategy.position_avg_price * (1 + SLPercent)
    shortStop
exitLong  = pos == -1

// === PlotColor === //
buySignal = pos == 1 and pos[1] == -1
plotshape(buySignal, title="Long", location=location.belowbar, style=shape.labelup, size=size.normal, color=color.new(color.green,50), text='Buy', textcolor=color.white)
exitSignal = pos == -1 and pos[1] == 1
plotshape(exitSignal, title="Exit", location=location.abovebar, style=shape.labeldown, size=size.normal, color=color.new(color.red,50), text='Exit', textcolor=color.white)

hPlot = plot(ohlc4, title="", style=plot.style_circles, linewidth=0, editable = false)
longFill = (pos == 1 ? color.new(color.green,80) : na)
shortFill = (pos == -1 ? color.new(color.red,80) : na)
fill(hPlot, atrtrend,color=longFill)
fill(hPlot,atrtrend, color=shortFill)

// === Strategy === //
strategy.entry('Long', strategy.long,limit = buyavg, when=window() and pos == 1,comment="Entry: "+str.tostring(buyavg))
strategy.close('Long', when=window() and exitLong , comment='Exit: '+str.tostring(sellavg) )

if Shortposenter
    strategy.entry('Short', strategy.short, when=window() and pos== -1,comment="Entry: "+str.tostring(close))
    strategy.close('Short', when=window() and pos == 1 , comment='Exit: ')

if useSL
    strategy.exit('Stop Loss', 'Long', stop=longStop)

// === Show StopLoss Price === //
if show_STOPLOSSprice
    if pos == -1
        label ShortStop = label.new(bar_index, na, 'SL: ' + str.tostring(ATR_TrailSL), color=color.green, textcolor=color.white, style=label.style_none, yloc=yloc.abovebar, size=size.small)
        label.delete(ShortStop[1])

    if pos == 1
        label LongStop = label.new(bar_index, na, 'SL: ' + str.tostring(ATR_TrailSL), color=color.red, textcolor=color.white, style=label.style_none, yloc=yloc.belowbar, size=size.small)
        label.delete(LongStop[1])