Monthly Performance PnL Calendar Strategy

Overview
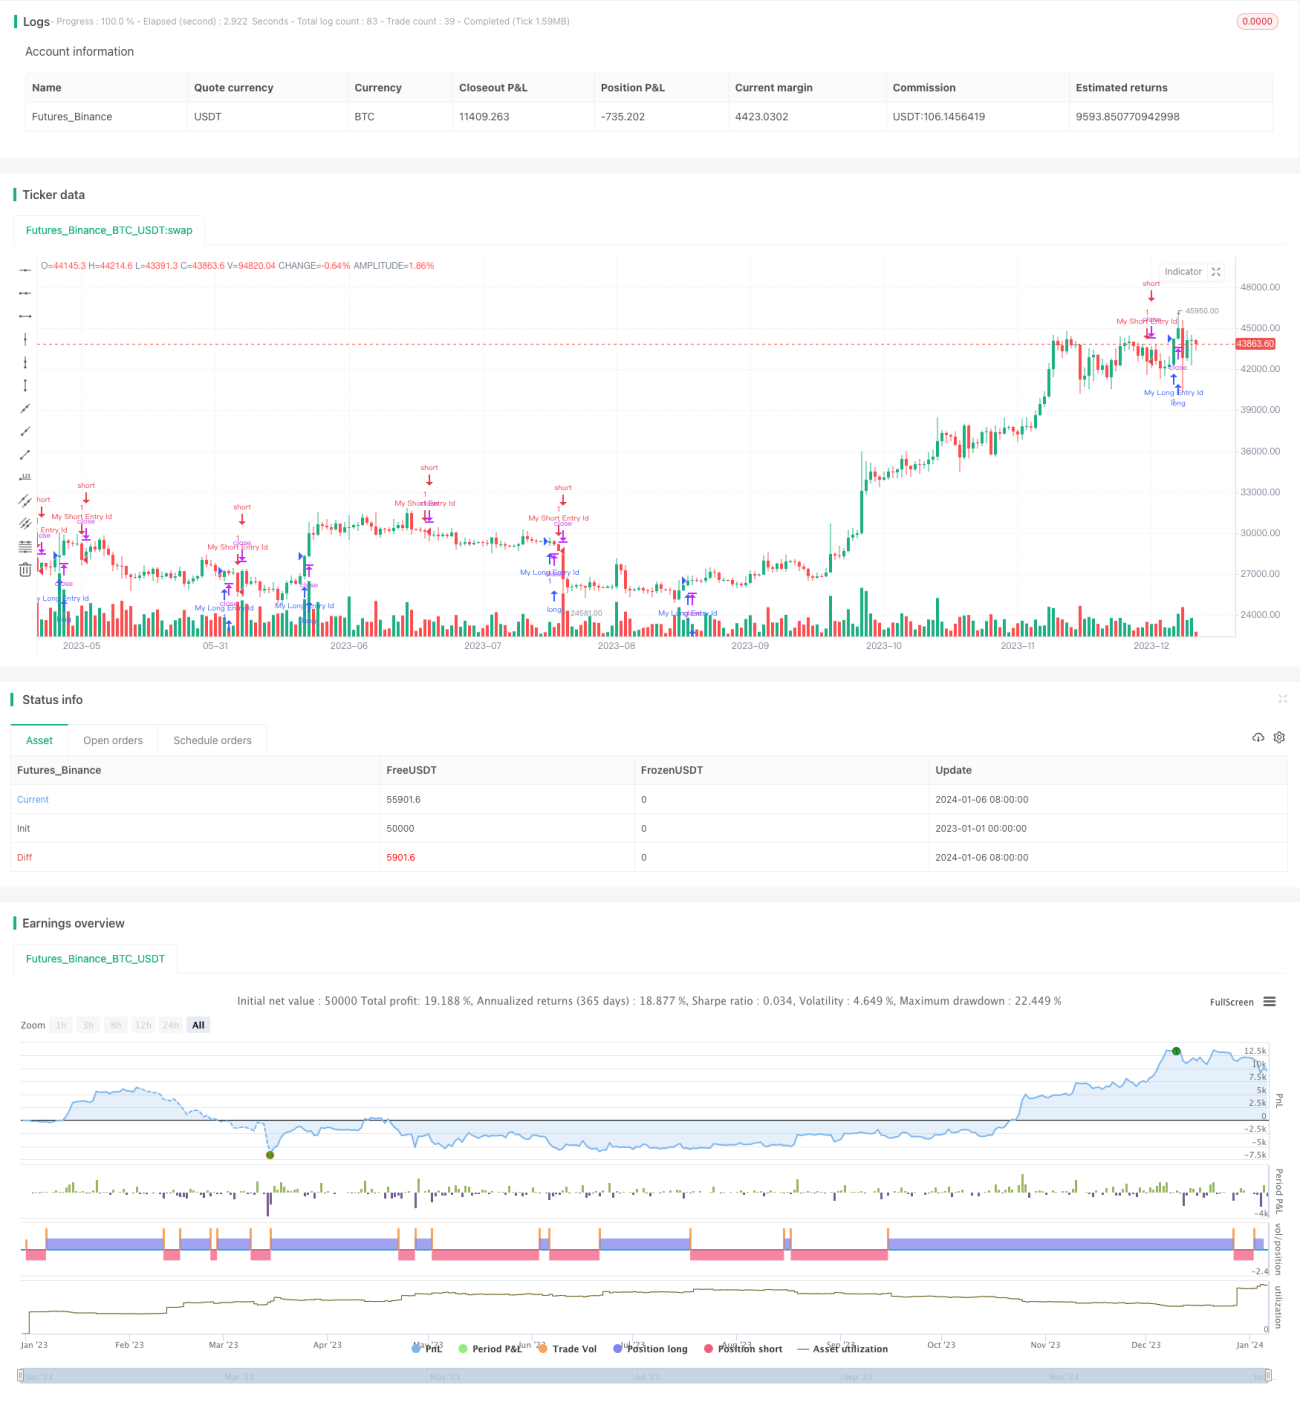
The main function of this strategy is to track and display the monthly performance in real time. It will update the profit and loss of each month in a table in real time.
Principle
The strategy achieves monthly performance tracking through the following steps:
- Define variables to record whether there are closed trades this month.
- Define variables to record the specific profit and loss value of each month.
- Define variables to record the month corresponding to the time.
- When there are closed trades this month, record the monthly PnL and month into corresponding arrays.
- Display month titles in specified positions in the table.
- Traverse the monthly PnL array and display PnL values in the corresponding month columns in the table.
- Display the corresponding year info at the same time.
- Summarize the PnL of each year.
- Use colors to distinguish positive and negative PnLs.
Above are the basic steps and working principles of this strategy.
Advantage Analysis
This kind of monthly performance tracking strategy has the following advantages:
- Real-time update to view the latest monthly PnL status anytime.
- Intuitive display of specific monthly PnL in tables.
- Fine-grained to see details of each month clearly.
- Intuitive comparison by using colors to contrast monthly PnLs more visually.
- Statistical summation also provides annual PnL summation.
- Customizable display to adjust table location, size etc.
Risk Analysis
This strategy also has some risks:
- Complex logic can cause inaccurate data due to errors.
- Too frequent table refresh may affect performance.
- Array data storage is less efficient.
- Time and month conversion calculations may go wrong.
Risks can be reduced through:
- Strict code review to ensure correct logic.
- Optimize refresh frequency to prevent over-refreshing.
- Use more efficient data structures to store data.
- Add exception handling for time and month conversions.
Optimization
Optimizations of this strategy:
- Use more efficient data structures like dictionaries to store monthly data.
- Add annualized return calculations.
- Add other metrics like rate of change.
- Visually display return curves.
- Support custom time range for statistics.
- Support exporting data to CSV files.
These can improve the strategy's functionality and user experience.
Conclusion
This strategy achieves the core function of real-time tracking and displaying monthly returns using arrays and tables. It is simple, efficient and easy to use. It also has some advantages but there are still some risks to prevent. With optimizations in logic and performance, it can become more perfect and powerful. Overall a very practical monthly performance tracking strategy.
- 1