Multi Timeframe MACD Moving Average Trading Strategy

1
Follow
1815
Followers
Overview
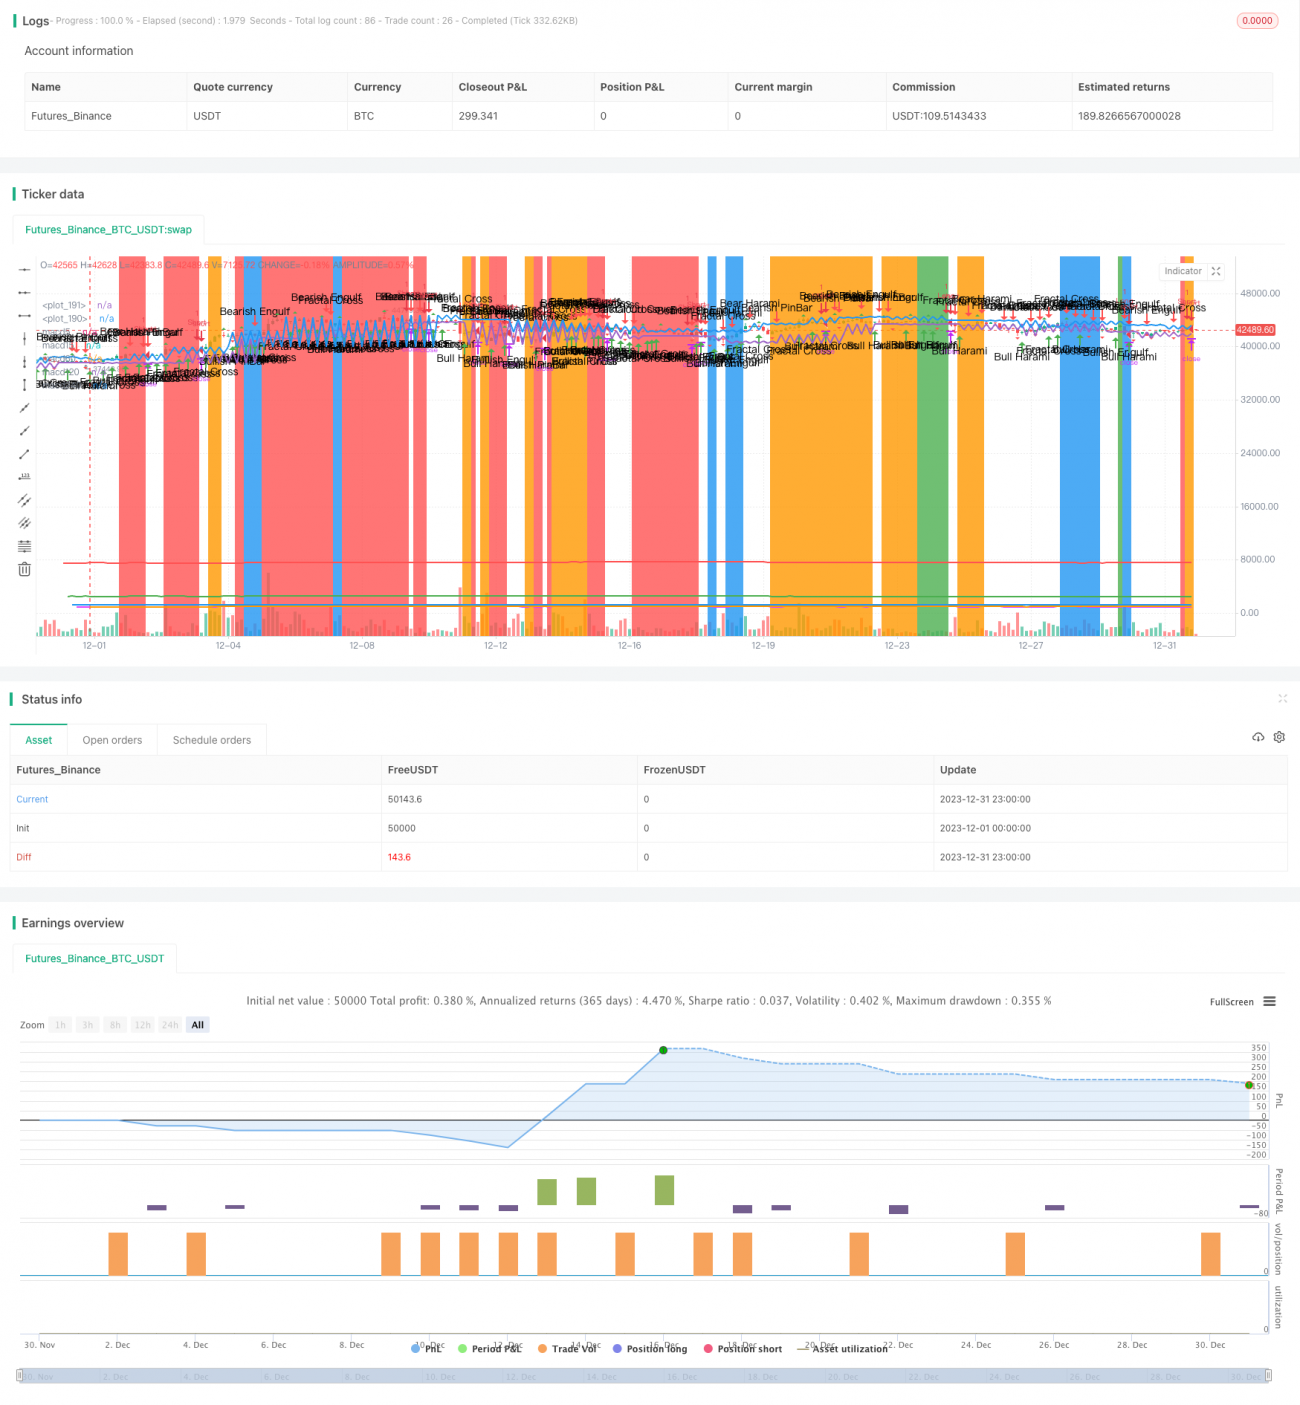
This strategy is based on the MACD indicator and moving averages across multiple timeframes to generate trading signals. It utilizes the performance of MACD on different periods as well as the price’s position relative to different moving averages to design entry and exit rules for long and short positions.
Strategy Logic
1. MACD Indicator
- Calculate 5-min, 15-min, 1-hour and 4-hour moving averages
- Judge the trend based on the price’s relationship with moving averages on different periods
2. RSI Indicator
- Calculate the RSI values on the current period and higher timeframe
- Use RSI topping and bottoming reversals to identify reversal signals
3. Candlestick Patterns
- Calculate various bullish and bearish candle combinations to identify reversal signals
- Pay attention to key support and resistance levels in combination with price levels
4. Entry Rules
Long Condition:
- Current period RSI breaks above lower line
- Higher period RSI shows bullish divergence, signaling impending reversal
Short Condition:
- Current period RSI breaks below upper line
- Higher period RSI shows bearish divergence, signaling impending reversal
5. Exit Rules
Close Long Condition:
- Candlestick shows reversal signal: trend reversal to bearish candle, e.g. Shooting Star and Dark Cloud Cover
Close Short Condition:
- Candlestick shows reversal signal: trend reversal to bullish candle, e.g. Hammer and Piercing Pattern
6. Risk Control
Set stop loss and take profit standards to limit losses and profit erosion.
Advantage Analysis
- Multiple indicator combination for more accurate signals
- Make full use of information across periods to improve profitability
- Strict entry and exit rules ensure controllable risks
Risks and Optimization
- Inappropriate parameter optimization may lead to over-trading
- Indicator parameters need optimization for different products
- Dynamic stop loss and take profit can help lock in profits
Summary
This is an overall robust strategy. By using multiple indicators and strict entry/exit rules, it can effectively capture market trends and avoid trading risks. But further optimization is needed to improve return stability.
Source
Pine
Strategy parameters
Related strategies
Comment
All comments (0)
No data
- 1