Overview
The Momentum Breakout Optimization strategy is a trend following strategy that generates trading signals and sets stop loss/take profit based on momentum indicators. It judges the market trend direction by calculating the crossovers between price and moving average, and builds a dynamic stop loss mechanism using ATR and LinReg Channel. Meanwhile, the strategy also identifies overbought/oversold levels using the CMO indicator for better entry prices.
Strategy Logic
- 1. Calculate the ZLEMA moving average of price as the technical indicator for trend direction
- 2. Calculate long stop loss and short stop loss based on ATR
- 3. Calculate the CMO indicator to identify overbought/oversold zones, combined with moving average as entry signals
- 4. Generate 3 sets of trading signals based on ATR, moving average and price breakouts
- Crossovers between moving average and stop loss levels
- Crossovers between price and stop loss levels
- Crossovers between price and moving average
- 5. Enable/Disable different signal combinations through parameter settings
- 6. Set risk percentage and position sizing for risk management
The overall strategy combines multiple indicators for steady trend following and automated stop loss, ensuring adequate trading opportunities while controlling trading risks.
Advantage Analysis
Combination of Multiple Indicators
The strategy utilizes a combination of indicators including moving average, ATR, CMO etc. The indicators complement each other and provide more reliable judgements on trend direction and overbought/oversold zones.
Dynamic Trailing Stop
The ATR-based dynamic stop loss can flexibly adjust stop loss levels based on market volatility, effectively controlling single trade loss.
Comprehensive Risk Management
The strategy provides position sizing and risk percentage settings, which defines the maximum percentage of capital at risk to prevent severe fund fluctuations.
Abundant Trading Signals
The strategy offers 3 sets of trading signals. By enabling different signal combinations, better backtest results can be obtained.
Risk Analysis
High Trading Frequency
There could be overly frequent trading when all signal combinations are enabled. This can be avoided by only using some of the signals.
Sensitive to Parameter Settings
The multiparameter model makes parameter optimization more complex and sensitive. The optimal parameter combination requires extensive testing.
Higher Drawdown for Breakout Signals
For the pure price/stop loss breakout signals, the stop loss range is wider, which may lead to larger single trade loss and drawdown. Combining with moving average signals is recommended.
Optimization Directions
Test Different Parameter Combinations
Optimize parameters like moving average type/length, ATR period, CMO period to find the optimal match.
Optimize Signal Usage Strategies
Test the performance of using only moving average signals, stop loss signals, or combination signals to find the best usage strategy.
Test Performance Across Different Products
Backtest the strategy across index, forex, commodity products to analyze adaptivity across different market types.
Conclusion
This strategy integrates multiple indicators for trend identification, stop loss construction, overbought/oversold detection. By tuning parameters and signal combinations, satisfactory risk metrics can be achieved. The overall system is comprehensive and reliable for further live testing and optimization.
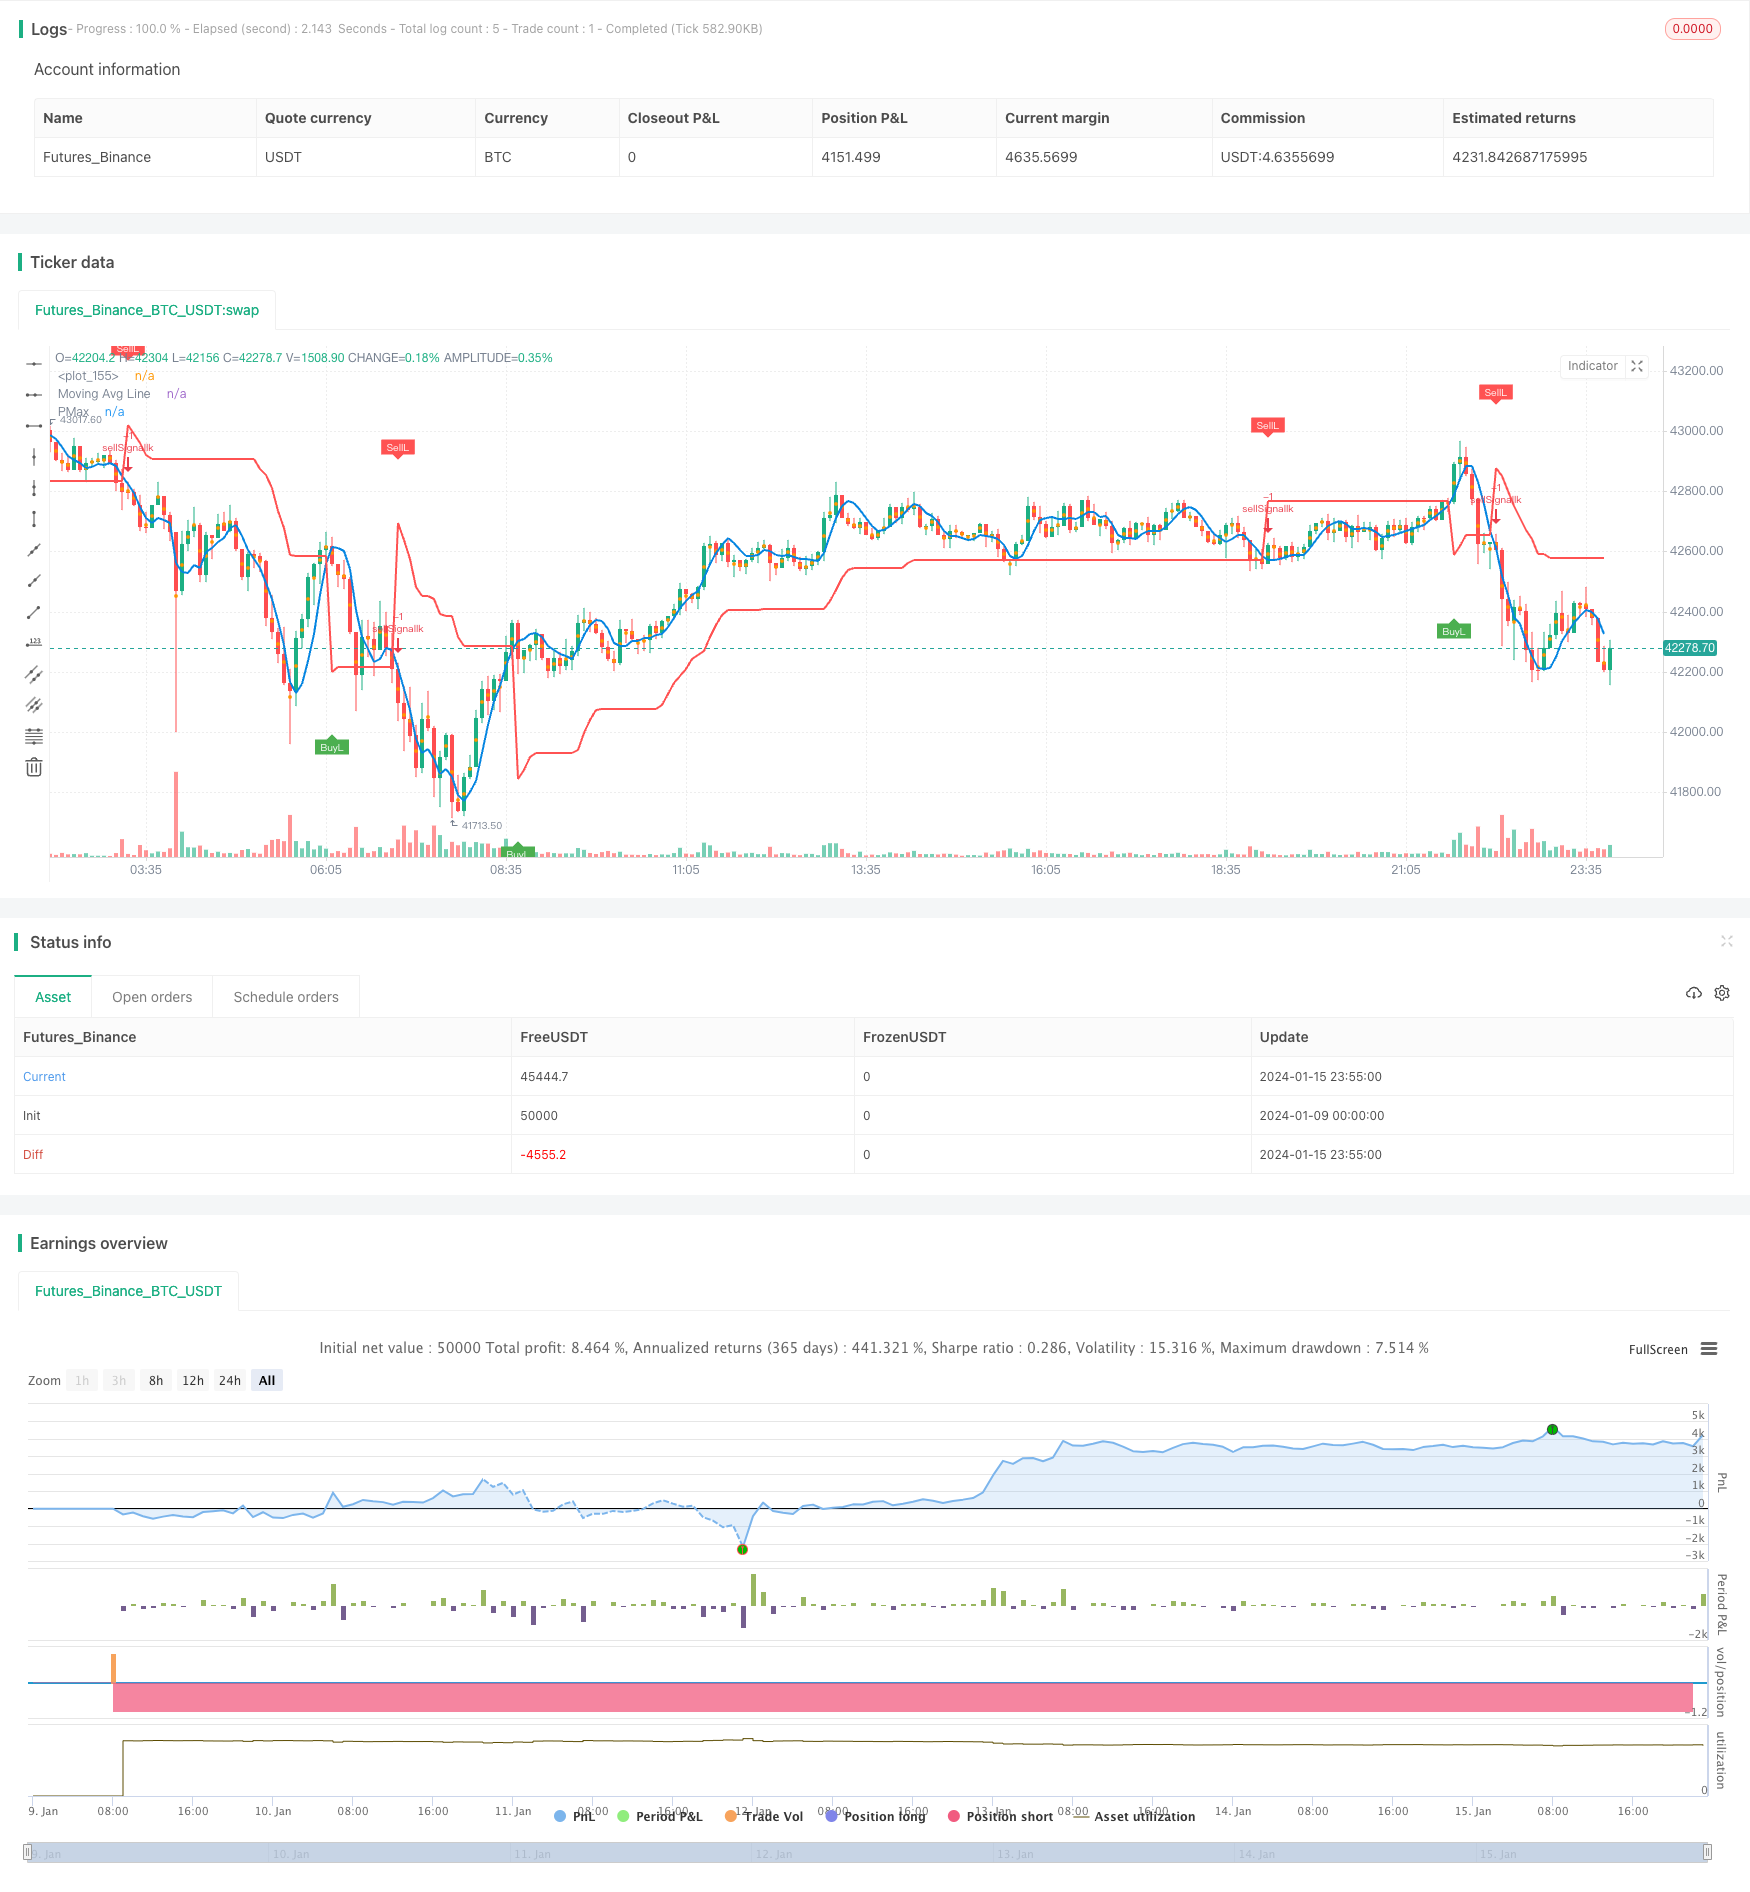
/*backtest
start: 2024-01-09 00:00:00
end: 2024-01-16 00:00:00
period: 5m
basePeriod: 1m
exchanges: [{"eid":"Futures_Binance","currency":"BTC_USDT"}]
*/

//@version=4
// This source code is subject to the terms of the Mozilla Public License 2.0 at https://mozilla.org/MPL/2.0/
// © KivancOzbilgic
//developer: @KivancOzbilgic
//author: @KivancOzbilgic

strategy(title="Profit Maximizer PMax", overlay=true,
     pyramiding=0, initial_capital=1000,
     commission_type=strategy.commission.cash_per_order,
     commission_value=0.025, slippage=2)


src = input(hl2, title="Source")
Periods = input(title="ATR Length", type=input.integer, defval=10)
Multiplier = input(title="ATR Multiplier", type=input.float, step=0.1, defval=3.0)
mav = input(title="Moving Average Type", defval="ZLEMA", options=["SMA", "EMA", "WMA", "TMA", "VAR", "WWMA", "ZLEMA", "TSF"])
length =input(10, "Moving Average Length", minval=1)
changeATR= input(title="Change ATR Calculation Method ?", type=input.bool, defval=true)
showsupport = input(title="Show Moving Average?", type=input.bool, defval=true)
showsignalsk = input(title="Show Crossing Signals?", type=input.bool, defval=true)
showsignalsc = input(title="Show Price/Pmax Crossing Signals?", type=input.bool, defval=false)
highlighting = input(title="Highlighter On/Off ?", type=input.bool, defval=true)

usePosSize = input(title="Use Position Sizing?", type=input.bool, defval=true)
riskPerc   = input(title="Risk %", type=input.float, defval=0.5, step=0.25)

// Make input options that configure backtest date range
startDate = input(title="Start Date", type=input.integer,
     defval=1, minval=1, maxval=31)
startMonth = input(title="Start Month", type=input.integer,
     defval=1, minval=1, maxval=12)
startYear = input(title="Start Year", type=input.integer,
     defval=2019, minval=1800, maxval=2100)

endDate = input(title="End Date", type=input.integer,
     defval=1, minval=1, maxval=31)
endMonth = input(title="End Month", type=input.integer,
     defval=12, minval=1, maxval=12)
endYear = input(title="End Year", type=input.integer,
     defval=2021, minval=1800, maxval=2100)

// Look if the close time of the current bar
// falls inside the date range
inDateRange = true

atr2 = sma(tr, Periods)
atr= changeATR ? atr(Periods) : atr2
valpha=2/(length+1)
vud1=src>src[1] ? src-src[1] : 0
vdd1=src<src[1] ? src[1]-src : 0
vUD=sum(vud1,9)
vDD=sum(vdd1,9)
vCMO=nz((vUD-vDD)/(vUD+vDD))
VAR=0.0
VAR:=nz(valpha*abs(vCMO)*src)+(1-valpha*abs(vCMO))*nz(VAR[1])
wwalpha = 1/ length
WWMA = 0.0
WWMA := wwalpha*src + (1-wwalpha)*nz(WWMA[1])
zxLag = length/2==round(length/2) ? length/2 : (length - 1) / 2
zxEMAData = (src + (src - src[zxLag]))
ZLEMA = ema(zxEMAData, length)
lrc = linreg(src, length, 0)
lrc1 = linreg(src,length,1)
lrs = (lrc-lrc1)
TSF = linreg(src, length, 0)+lrs
getMA(src, length) =>
    ma = 0.0
    if mav == "SMA"
        ma := sma(src, length)
        ma

    if mav == "EMA"
        ma := ema(src, length)
        ma

    if mav == "WMA"
        ma := wma(src, length)
        ma

    if mav == "TMA"
        ma := sma(sma(src, ceil(length / 2)), floor(length / 2) + 1)
        ma

    if mav == "VAR"
        ma := VAR
        ma

    if mav == "WWMA"
        ma := WWMA
        ma

    if mav == "ZLEMA"
        ma := ZLEMA
        ma

    if mav == "TSF"
        ma := TSF
        ma
    ma

MAvg=getMA(src, length)
longStop = MAvg - Multiplier*atr
longStopPrev = nz(longStop[1], longStop)
longStop := MAvg > longStopPrev ? max(longStop, longStopPrev) : longStop
shortStop = MAvg + Multiplier*atr
shortStopPrev = nz(shortStop[1], shortStop)
shortStop := MAvg < shortStopPrev ? min(shortStop, shortStopPrev) : shortStop
dir = 1
dir := nz(dir[1], dir)
dir := dir == -1 and MAvg > shortStopPrev ? 1 : dir == 1 and MAvg < longStopPrev ? -1 : dir
PMax = dir==1 ? longStop: shortStop
plot(showsupport ? MAvg : na, color=#0585E1, linewidth=2, title="Moving Avg Line")
pALL=plot(PMax, color=color.red, linewidth=2, title="PMax", transp=0)

alertcondition(cross(MAvg, PMax), title="Cross Alert", message="PMax - Moving Avg Crossing!")
alertcondition(crossover(MAvg, PMax), title="Crossover Alarm", message="Moving Avg BUY SIGNAL!")
alertcondition(crossunder(MAvg, PMax), title="Crossunder Alarm", message="Moving Avg SELL SIGNAL!")
alertcondition(cross(src, PMax), title="Price Cross Alert", message="PMax - Price Crossing!")
alertcondition(crossover(src, PMax), title="Price Crossover Alarm", message="PRICE OVER PMax - BUY SIGNAL!")
alertcondition(crossunder(src, PMax), title="Price Crossunder Alarm", message="PRICE UNDER PMax - SELL SIGNAL!")


// Calculate position size
riskEquity  = (riskPerc / 100) * strategy.equity
atrCurrency = (atr(20) * syminfo.pointvalue)
posSize     = usePosSize ? floor(riskEquity / atrCurrency) : 1

//Long
buySignalk = crossover(MAvg, PMax)
plotshape(buySignalk and showsignalsk ? PMax*0.995 : na, title="Buy", text="BuyL", location=location.absolute, style=shape.labelup, size=size.tiny, color=color.green, textcolor=color.white, transp=0)


if(buySignalk and showsignalsk and inDateRange)
    strategy.entry(id="buySignalk", long=true, qty=posSize)

sellSignallk = crossunder(MAvg, PMax)
plotshape(sellSignallk and showsignalsk ? PMax*1.005 : na, title="Sell", text="SellL", location=location.absolute, style=shape.labeldown, size=size.tiny, color=color.red, textcolor=color.white, transp=0)

if(sellSignallk and showsignalsk and inDateRange)
    strategy.order(id="sellSignallk", long=false, qty=strategy.position_size)

//Short
buySignalc = crossover(src, PMax)
plotshape(buySignalc and showsignalsc ? PMax*0.995 : na, title="Buy", text="BuyS", location=location.absolute, style=shape.labelup, size=size.tiny, color=#0F18BF, textcolor=color.white, transp=0)

if(buySignalc and showsignalsc and inDateRange)
    strategy.entry(id="BuyS", long=false, qty=posSize)

sellSignallc = crossunder(src, PMax)
plotshape(sellSignallc and showsignalsc ? PMax*1.005 : na, title="Sell", text="SellS", location=location.absolute, style=shape.labeldown, size=size.tiny, color=#0F18BF, textcolor=color.white, transp=0)

if(sellSignallc and showsignalsc and inDateRange)
    strategy.order(id="SellS", long=true, qty=abs(strategy.position_size))

mPlot = plot(ohlc4, title="", style=plot.style_circles, linewidth=0,display=display.none)

longFillColor = highlighting ? (MAvg>PMax ? color.green : na) : na
shortFillColor = highlighting ? (MAvg<PMax ? color.red : na) : na

fill(mPlot, pALL, title="UpTrend Highligter", color=longFillColor)
fill(mPlot, pALL, title="DownTrend Highligter", color=shortFillColor)

// Exit open market position when date range ends
if (not inDateRange)
    strategy.close_all()