Momentum Tracking Strategy Based on Ichimoku Cloud

Overview
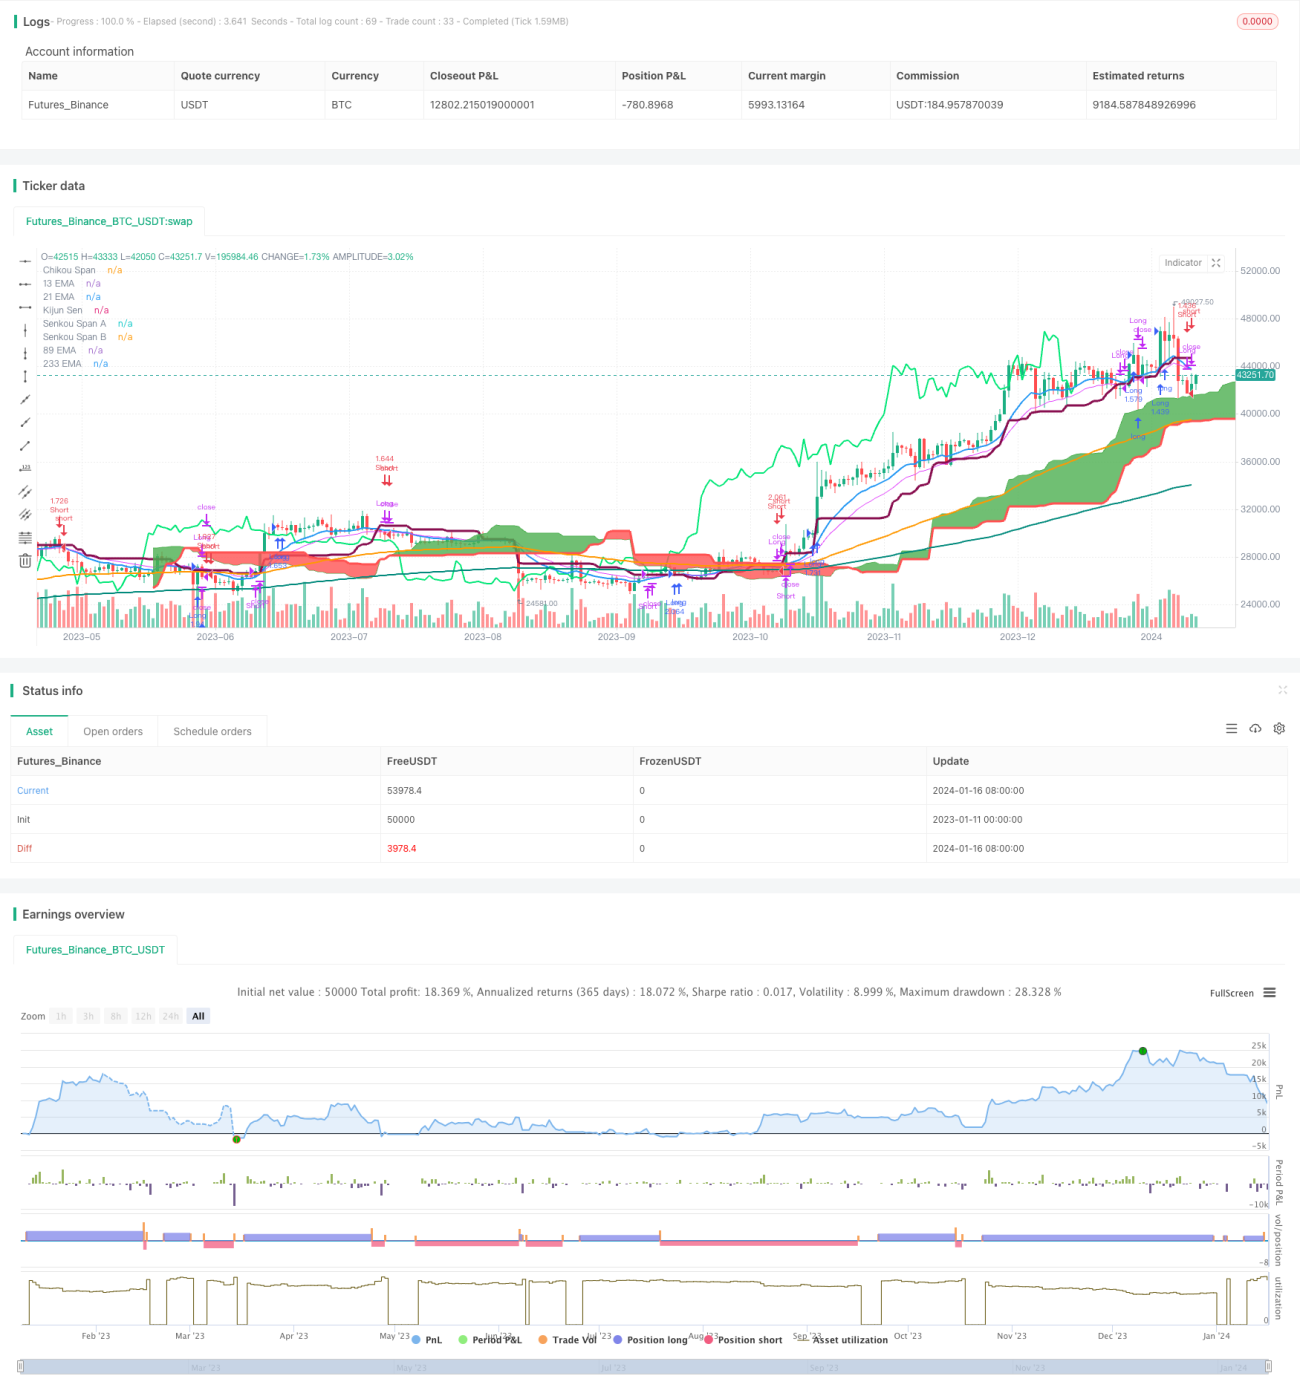
This strategy combines moving averages, relative strength index (RSI) and ichimoku cloud to identify price trends and make trades accordingly. The core idea is to generate buy signals when the short term moving average crosses above the medium term average and penetrates above the cloud, and to generate sell signals when the reverse happens.
Strategy Logic
The strategy employs four moving averages - 13, 21, 89 and 233 days. The 13 day MA represents short term trend while the 233 day line shows long term trend. The 21 and 89 day MAs are in between. When the short term MA crosses above the medium term ones, it indicates an upside breakout and generates buy signals. The opposite cross leads to sell signals.
In addition, the conversion line (9 day MA), base line (26 day MA) and leading span (average of conversion and base lines) of the Ichimoku cloud are used. Penetrating above the leading span gives buy signals while breaking below it shows sells.
Furthermore, 12 and 24 day RSIs are applied. The 12 day RSI represents short term overbought/oversold levels while the 24 day line shows medium term situations. Crossovers between the two can help confirm trading signals.
Advantages
- Identify trend direction with MAs
- Ichimoku cloud for entry and exit timing
- Avoid false breakouts using RSI
This strategy excels at capturing the prevailing trend of security prices. Entry and exit based on MAs and ichimoku improves precision. Moreover, RSI crossover helps avoid false signals. In summary, this combines strengths of multiple indicators to effectively trade along the trend.
Risks
-
Trend reversal risk
Traders should watch out for prices touching moving averages and get ready to close positions. -
Parameter optimization
There are rooms to improve MA periods, Ichimoku parameters etc. Traders can experiment to find the optimal set for different products. -
High trading frequency
The strategy may trade quite frequently, thus commission costs need to be considered. Fine tuning parameters can help reduce unnecessary trades.
Improvements
-
Add stop loss/profit target
Introducing such risk management mechanisms would reduce drawdowns. -
Parameter tuning
Optimize MA periods, Ichimoku inputs, RSI days etc for better stability across different products. -
Incorporate more indicators
Other derived indicators around volatility and volume could provide additional insight.
Conclusion
This is a typical trend following strategy harnessing strengths of MAs, RSI and Ichimoku cloud. It reliably locks onto prevailing trends. Through refinements like stop loss, parameter optimization etc, performance can be further improved. Overall this is a stable, profitable momentum strategy suitable for investors with adequate risk appetite seeking persistent gains.
/*backtest
start: 2023-01-11 00:00:00
end: 2024-01-17 00:00:00
period: 1d
basePeriod: 1h
exchanges: [{"eid":"Futures_Binance","currency":"BTC_USDT"}]
*/

//@version=3

strategy("EMA + Ichimoku Kinko Hyo Strategy", shorttitle="EMI", overlay=true, default_qty_type=strategy.percent_of_equity, max_bars_back=1000, default_qty_value=100, calc_on_order_fills= true, calc_on_every_tick=true, pyramiding=0)
- 1