Dual EMA and RSI Combined Trend Tracking Strategy

Overview
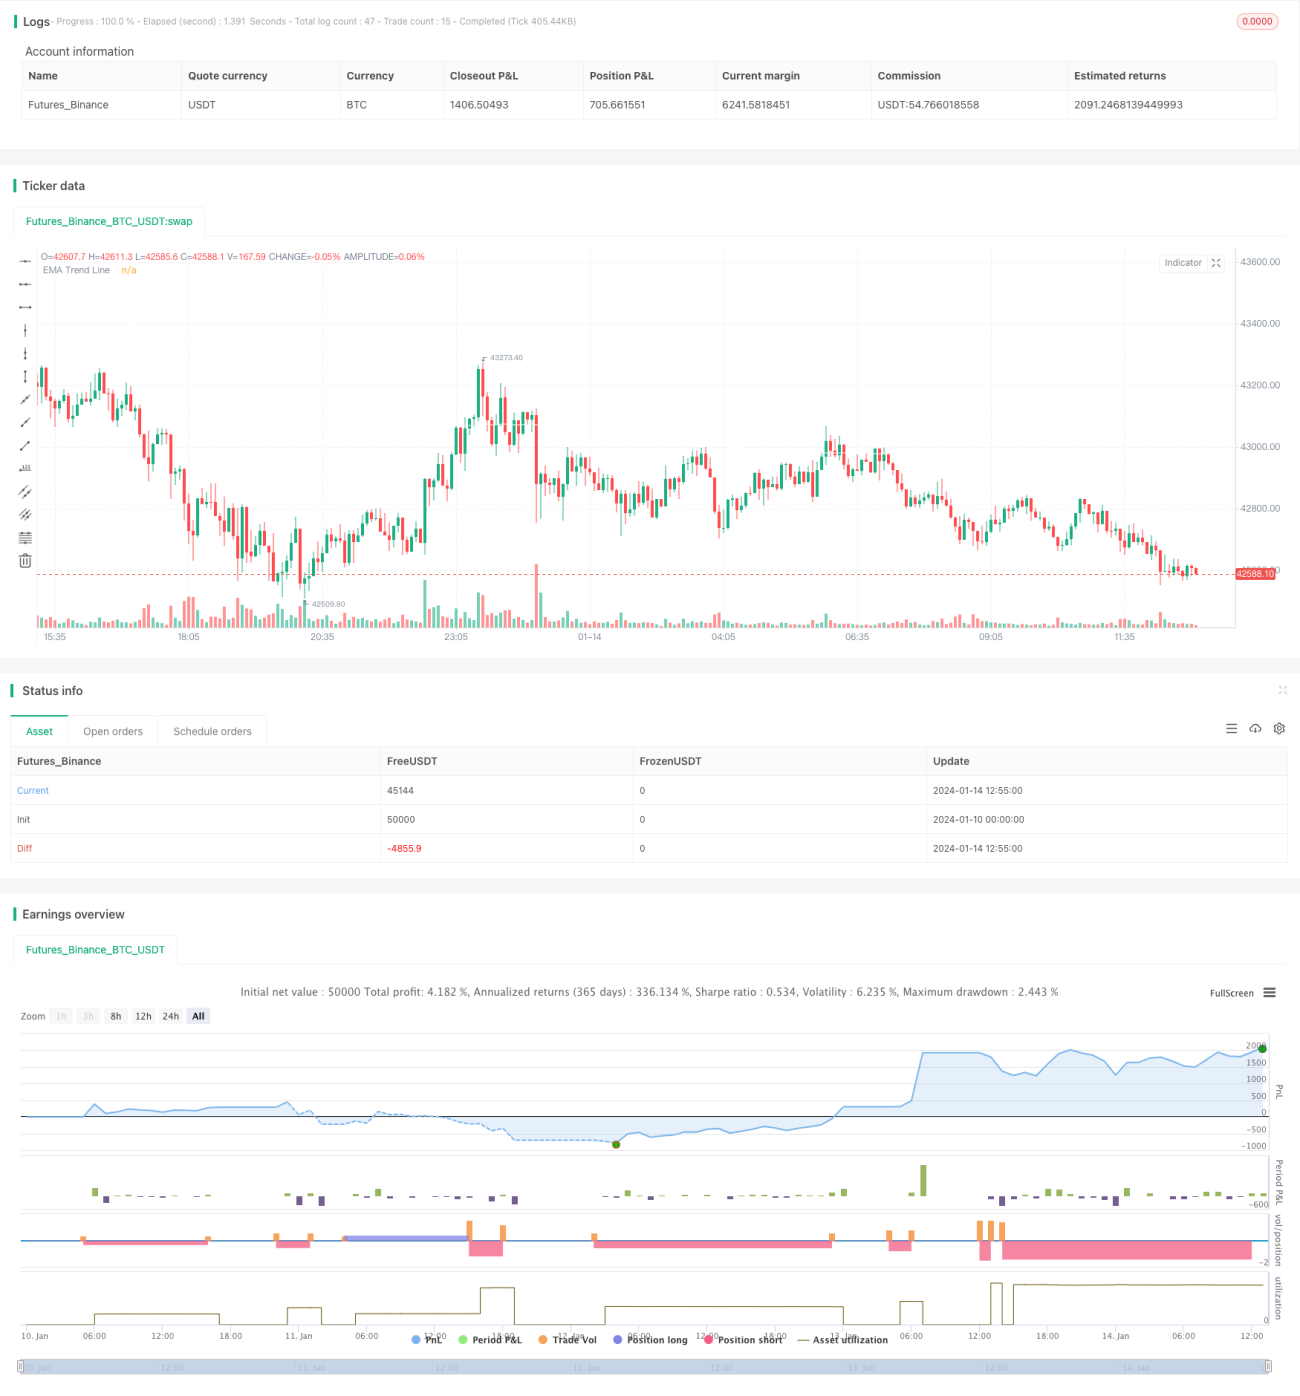
This strategy combines the use of dual EMA and RSI indicators to identify price trends and take timely positions when trend reversals occur. Specifically, the strategy uses a longer cycle EMA to judge the major trend direction, while using the RSI indicator to determine short-term overbought and oversold conditions. It generates trading signals through the RSI indicator when prices pull back within the major trend direction for long or short entries accordingly.
Strategy Logic
-
Use a 200 period EMA to determine the major trend direction. Price crossing above the EMA line signals bullish view, while crossing below signals bearish view.
-
RSI indicator parameter set to 10 periods. RSI crossing above 40 signals oversold condition, while crossing below 60 signals overbought condition.
-
When major trend is up (price above EMA line) and RSI crossing below 40 oversold signal occurs, go long.
-
When major trend is down (price below EMA line) and RSI crossing above 60 overbought signal occurs, go short.
-
Stop loss set to 4 times of ATR indicator. Take profit set to 2 times of stop loss for 2:1 risk reward ratio.
Advantage Analysis
The biggest advantage of this strategy is the combination of both trend and reversal indicators, which allows timely entries when pullbacks occur within trends, hence better performance can be obtained. Specific advantages include:
-
Using dual EMA system to determine primary trend direction for effective trend tracking.
-
RSI indicator identifies short-term overbought/oversold conditions, assisting entry timing.
-
Stop loss set via ATR indicator adapts to market volatility for better risk control.
-
Strictly following trend trading principles reduces unnecessary trades and system risk.
Risk Analysis
Main risks of this strategy includes:
-
False trading signals may occur when trend weakens and prices oscillate. Trade cautiously during these times.
-
Stop loss set by ATR may be too wide or too tight in extreme market conditions. Dynamic adjustments or other stop loss mechanisms should be considered.
-
Potentially high signal frequency requires matching personal trading frequency preference.
-
RSI parameter appropriateness needs to be monitored for timely optimization.
Optimization Directions
Main optimization directions include:
-
Test adding other trend indicators like MACD to assist trend judgment.
-
Test combining RSI with other reversal indicators like KDJ, Bollinger Bands for better signals.
-
Introduce machine learning algorithms for dynamic parameter adjustments and adaptive stop loss/profit taking.
-
Incorporate more factors like sentiments, news for higher system robustness.
Conclusion
Overall this is a very typical short-term strategy combining trend tracking and reversal indicators. It judges major trend with dual EMA and captures pullback opportunities within trends using the reversal characteristics of RSI. In principle, this strategy combines the strengths of different indicators for very good complementary effects. Further improvements on parameters optimization, model fusion etc. can significantly enhance its performance.
- 1