Multi-timeframe RSI and Moving Average Trading Strategy

Overview
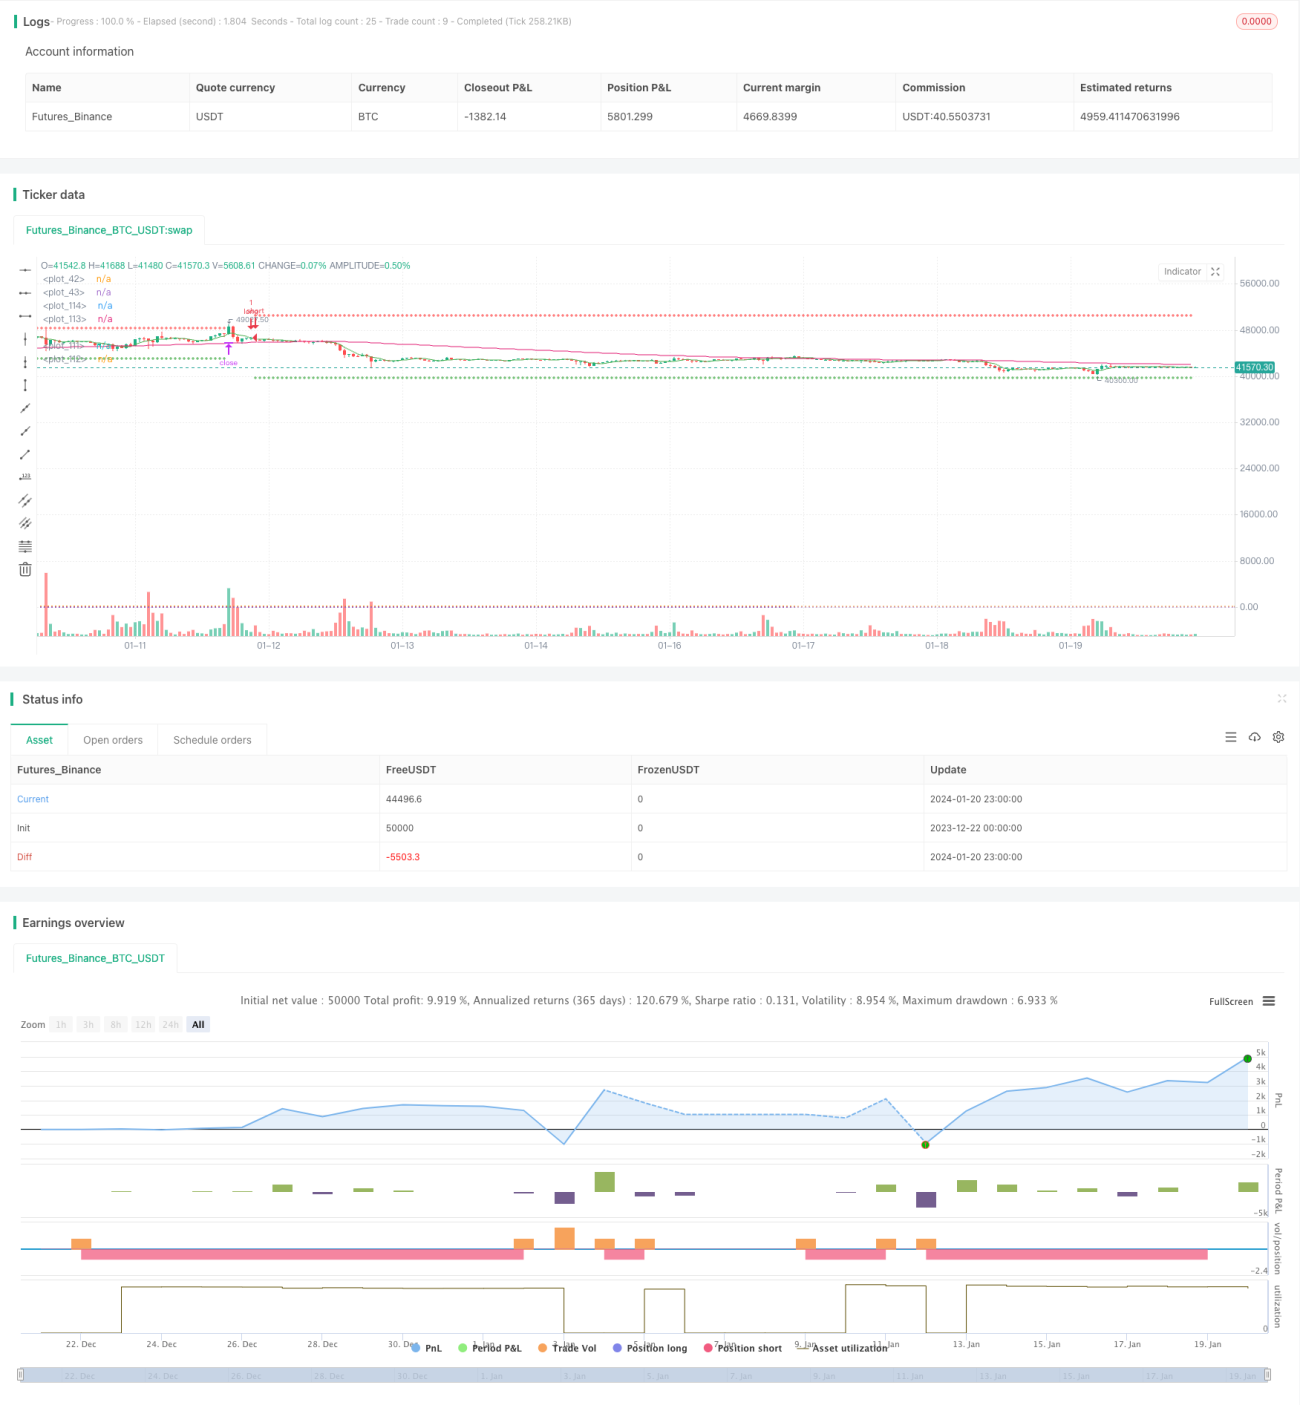
This strategy combines the RSI indicator, simple moving average (SMA) and weighted moving average (WMA) to identify trading signals. It judges the trend direction simultaneously on the 5-min and 1-hour timeframes. Trading signals are generated when the fast RSI line crosses over or under the slow line during a steady trend.
Strategy Logic
The strategy first calculates the 144-period WMA and 5-period SMA on both the 1-hour and 5-min timeframes. A bullish market is identified only when the 5-min SMA is above the WMA. The strategy then computes the RSI oscillator and the corresponding K and D lines. Sell signals are generated when the K line crosses below the D line from the overbought area. Buy signals are generated when the K line crosses over the D line from the oversold area.
Advantage Analysis
This is a very effective trend-following strategy. By incorporating two timeframes to determine the trend, it significantly reduces false signals. In addition, it combines multiple filters including RSI, SMA and WMA to make the signals more reliable. By driving KDJ with RSI, it also avoids some fake signals inherent in the normal KDJ strategy. Furthermore, proper stop loss and take profit settings help lock in profits and control risks.
Risk Analysis
The biggest risk of this strategy lies in wrong trend judgement. At turning points, the short-term and long-term moving averages may flip upside or downside together, resulting in wrong signals. Also, RSI may generate more noisy signals during ranging markets. However, these risks can be reduced by properly adjusting the periods of SMA, WMA and RSI parameters.
Optimization Directions
The strategy can be improved from the following aspects:
- Test different lengths of SMA, WMA and RSI to find the optimal combination
- Incorporate other indicators like MACD, Bollinger Bands to verify signal reliability
- Optimize stop loss and take profit mechanisms by testing fixed ratio stops, trailing stops etc.
- Add capital management modules to control trade sizing and overall risk exposure
- Introduce machine learning models to find the best performing parameters through large-scale backtesting
Summary
The strategy fully utilizes the strengths of moving averages and oscillators to establish a relatively solid trend following system. By confirming signals across multiple timeframes and indicators, it can smoothly capture mid to long term trends. The stop loss and take profit settings also make it withstand normal market fluctuations to a certain degree. However, there are still rooms of improvement, such as testing more indicator combinations, leveraging machine learning for parameter optimization. Overall speaking, this is a very promising trading strategy.
/*backtest
start: 2023-12-22 00:00:00
end: 2024-01-21 00:00:00
period: 1h
basePeriod: 15m
exchanges: [{"eid":"Futures_Binance","currency":"BTC_USDT"}]
*/

// This source code is subject to the terms of the Mozilla Public License 2.0 at https://mozilla.org/MPL/2.0/
// © bufirolas

// Works well with a wide stop with 20 bars lookback- 1