S&P500 Hybrid Seasonal Trading Strategy

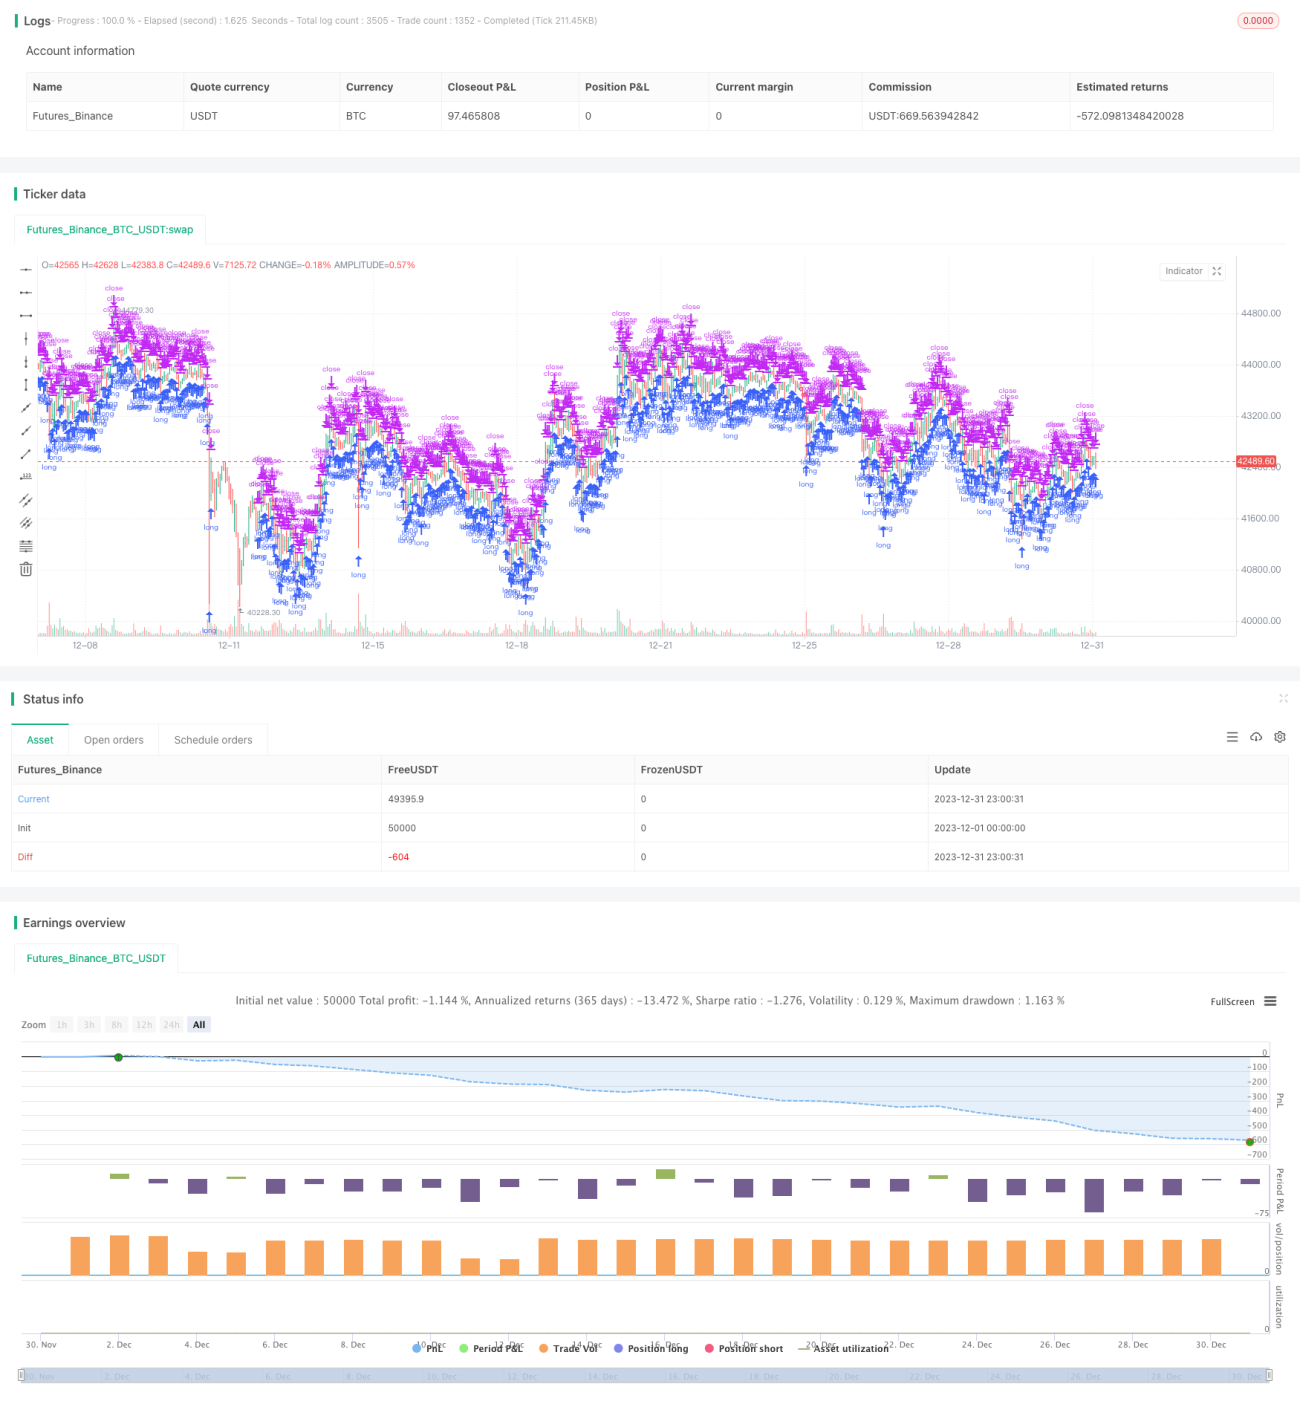
Overview
The S&P500 Hybrid Seasonal Trading Strategy is a quantitative strategy that trades stocks based on seasonal patterns. It combines an enhanced buy & hold system, technical indicator conditions, and volume flow indicators to rotate between the better and worse performing months of the year.
Strategy Logic
The main trading signals and rules are:
- Go long at the open on the first trading day of October every year.
- If the VIX is above 60% or the 15-day ATR is above 90%, pause seasonal trading until volatility subsides later in the month or year.
- Exit longs/short at the open on the first trading day of August every year.
- Exit longs/short also if VIX exceeds 120% or if VFI crosses below -20 while its 10-day MA points down.
- Optional short selling enabled.
The strategy capitalizes on the uneven performance of the stock market through the year, going long during October-April which statistically outperformed and taking profit or shorting during the poorer performing months of May-September. Risk is also managed by pausing trading when volatility spikes, as measured by indicators like VIX and ATR.
Advantage Analysis
The S&P500 Hybrid Seasonal Trading Strategy has the following key advantages:
- Leverages established, stable seasonal patterns grounded in the empirically observed uneven monthly performance of the S&P500 index through the year.
- Incorporates multiple filter conditions like VIX, ATR and VFI to effectively filter out noise and generate more reliable trading signals.
- Configurable trading rules for going long/short and custom periods for seasonal entry and exit that facilitate testing and optimization.
- Embedded risk avoidance mechanisms via volatility measures like VIX and ATR thresholds to bypass effects from violent market swings.
- Supplementary signal input from volume flow indicator reflecting potential shifts in market participation.
Risk Analysis
Some potential risks include:
- Invalidation risk of historical patterns. Markets evolve stochastically so historical tendencies may not always endure.
- Missignal risk from technical indicators. VIX, ATR and VFI can also generate false signals.
- Suboptimal parameter risk. Further parameter testing and tuning is possible since current values may not be globally optimal.
- Additional shorting risks like unlimited losses.
Risks can be mitigated via more rigorous risk controls, combination of indicators, parameter tuning, machine learning etc.
Enhancement Opportunities
Possible optimization opportunities:
- Longer backtest periods for more training data.
- Introduce stop loss mechanisms to control loss per trade.
- Fine-tune parameters of indicators like VIX, ATR and VFI to find best combinations.
- Deploy machine learning models to enable adaptive optimization.
- Ensemble strategies to lower systemic market risk via non-correlation.
Conclusion
The S&P500 Hybrid Seasonal Trading Strategy synthesizes well established seasonal tendencies, technical timing indicators and money flow measures. By avoiding the worst performing months of the year and positioning in the seasonally stronger months supplemented by effective volatility gating, the framework can yield consistent alpha. The adaptable structure also provides useful modular components for practitioners to test, optimize and build upon. Additional data, stop losses, parameter tuning and ensembles present further opportunity to improve performance.
/*backtest
start: 2023-12-01 00:00:00
end: 2023-12-31 23:59:59
period: 1h
basePeriod: 15m
exchanges: [{"eid":"Futures_Binance","currency":"BTC_USDT"}]
*/

//  TASC Issue: April 2022 - Vol. 40, Issue 4
//     Article: Sell In May? Stock Market Seasonality
//  Article By: Markos Katsanos
// Language: TradingView's Pine Script v5- 1