Multi Timeframe Trend Following Strategy

Overview
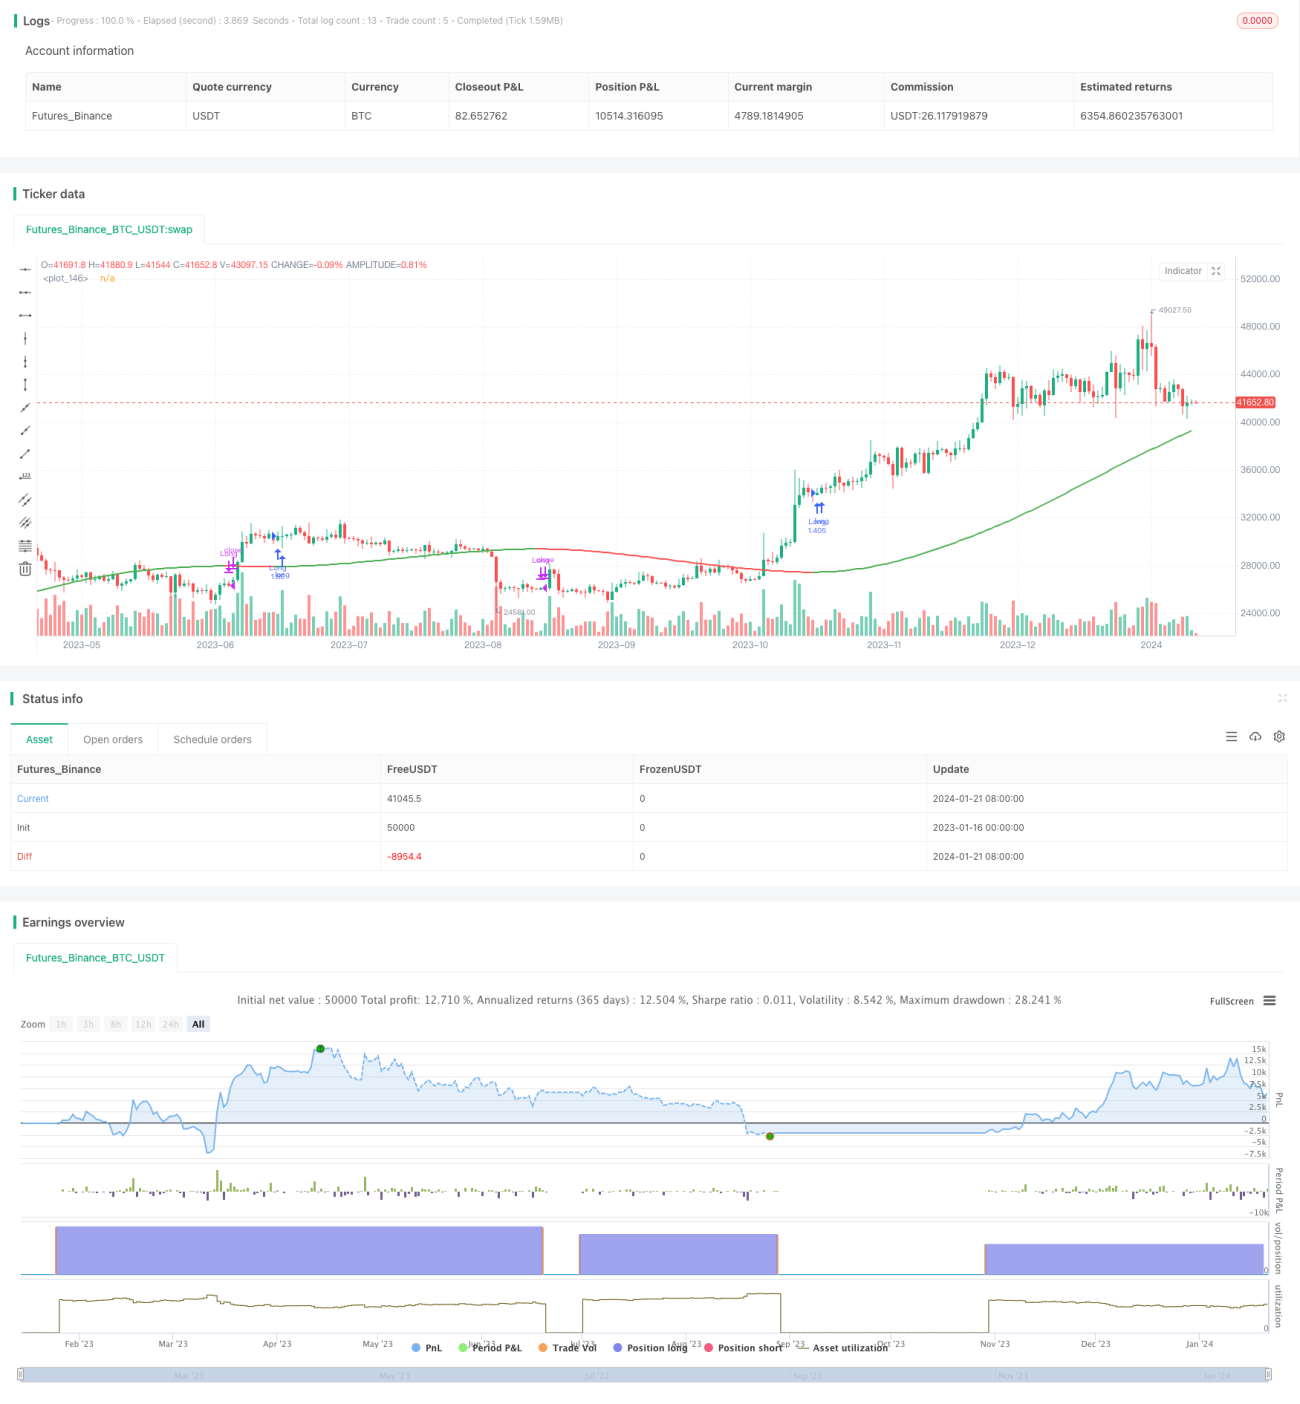
The Multi Timeframe Trend Following Strategy is a trend following strategy that incorporates multiple moving averages and regression lines. This strategy allows selecting from over 20 different trend indicators and implements automated entries and exits.
Strategy Logic
The core of this strategy is to determine if the price is in an uptrend or a downtrend based on the selected trend indicator by the user. The strategy first calculates over 20 moving averages and regression lines. These indicators include the common technical indicators in the Pine scripting language standard library, as well as some custom indicators written by the Pine coder community. The strategy then queries the current value of a selected indicator and compares it to the previous value. If the current value is greater than the previous value, the trend is up. If the current value is less than the previous value, the trend is down. Finally, the strategy determines if it should enter a long position based on the direction of the trend. It enters long in an uptrend and exits the position in a downtrend.
Pros Analysis
This strategy incorporates over 20 indicators to determine the trend, avoiding the possibility of misjudgment from a single indicator. These indicators have been validated by the coder community. The parameters can be tuned to adapt to different market conditions.
Compared to simple dual moving average strategies, this strategy relies solely on one indicator to determine the trend direction and thus expresses the trend better without false signals when two indicators contradict.
Risk Analysis
This strategy relies on indicators to determine the trend and cannot detect if a trend reversal is occurring. This can introduce some degree of lag, leading to losses or missed opportunities. This issue can be mitigated by tuning the indicator parameters.
All trend following strategies suffer significant losses when black swan events occur. Stops should be implemented to control risks.
Enhancement Opportunities
Consider incorporating other indicators to predict trend reversals and reduce lagging issues. For example, incorporate Bollinger Bands to detect overextended moves.
Design emergency stop mechanisms for black swan events. For example, trigger forced liquidation if the strategy loses more than 5% in a single day.
Conclusion
The Multi Timeframe Trend Following Strategy incorporates over 20 indicators to express the market trend and avoids false signals. It also retains high customizability to adapt to significantly different market conditions. It is a very effective trend following strategy. With proper stop losses and indicator parameter tuning, it can achieve good returns while controlling risks.
/*backtest
start: 2023-01-16 00:00:00
end: 2024-01-22 00:00:00
period: 1d
basePeriod: 1h
exchanges: [{"eid":"Futures_Binance","currency":"BTC_USDT"}]
*/

// This source code is subject to the terms of the Mozilla Public License 2.0 at https://mozilla.org/MPL/2.0/
// @version=5
// Author = TradeAutomation
- 1