Force Breakthrough Strategy

Overview
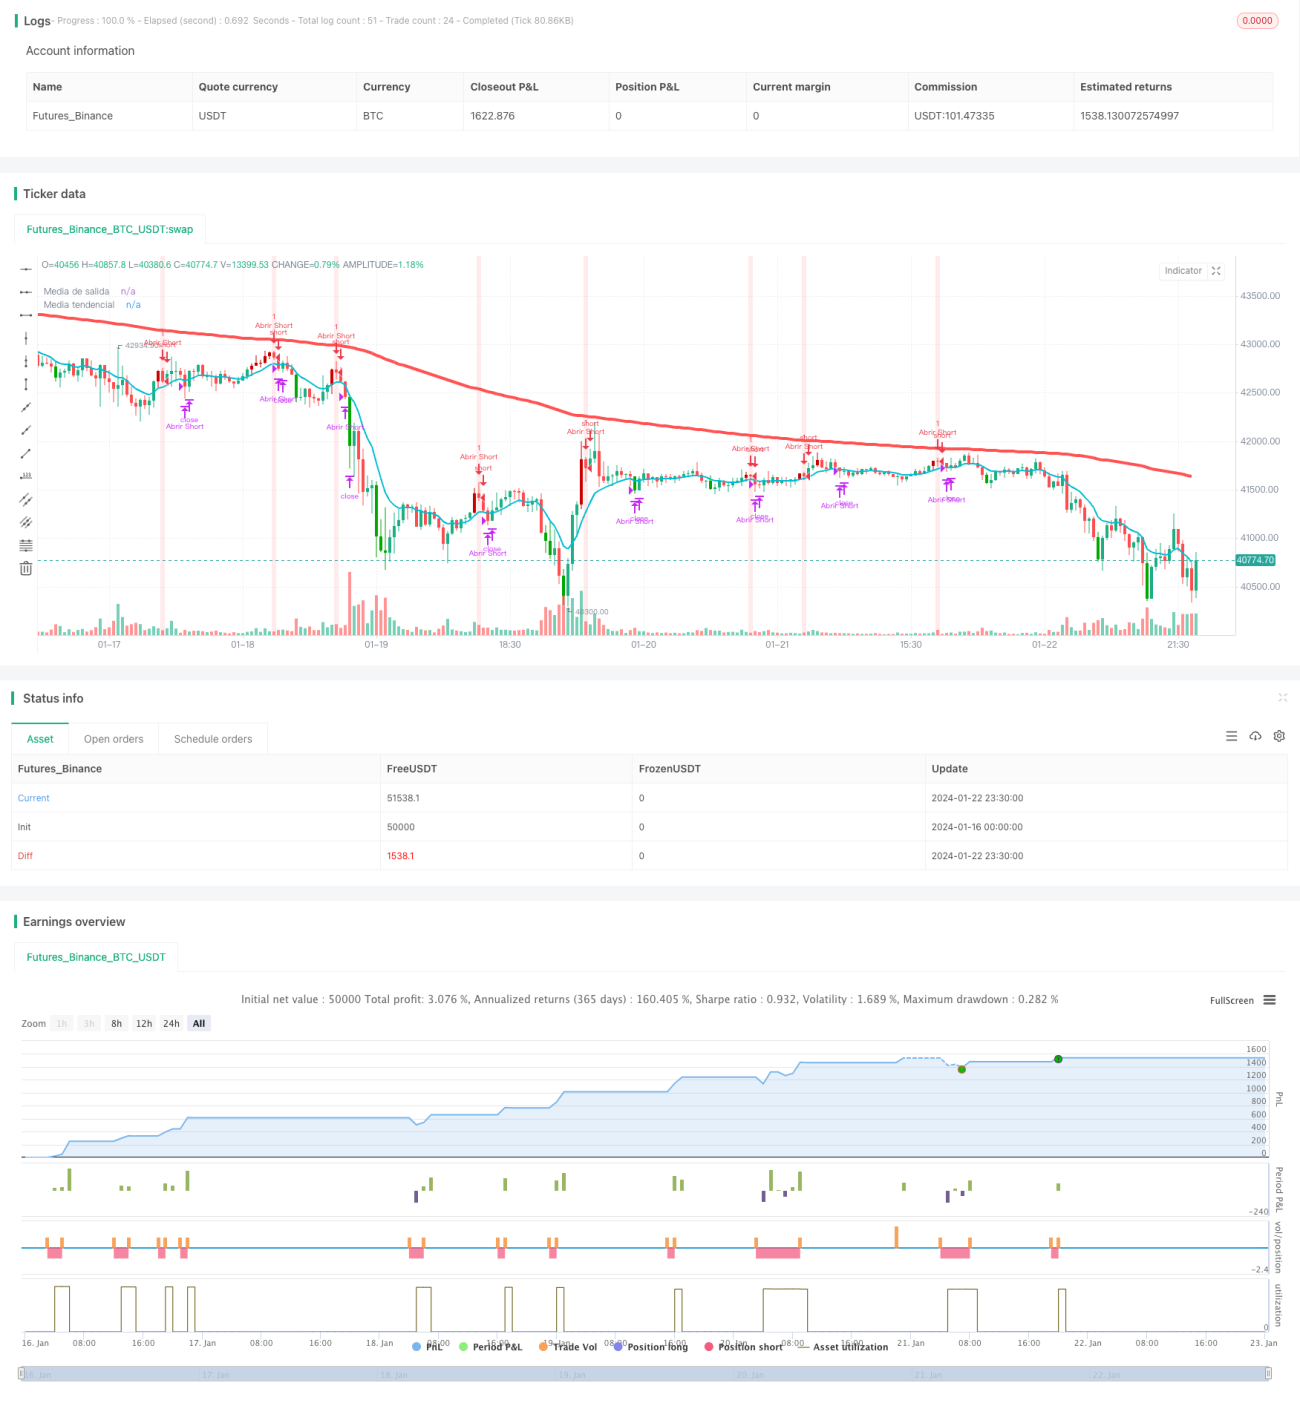
The Force Breakthrough Strategy is a quantitative trading strategy based on moving averages and the Relative Strength Index (RSI). It detects the market trend direction by monitoring price breakthroughs of key moving averages and uses the RSI indicator to determine entry signals. The core idea is to issue trading signals when prices penetrate the moving average, combined with the RSI indicator's overbought/oversold signals.
Strategy Logic
The Force Breakthrough Strategy employs two moving averages. The first is a 10-period EMA as the fast moving average. The second is a 200-period EMA as the slow moving average. The fast line represents the current price trend and the slow line represents the long-term price trend. When prices rise and penetrate above the 10-day line, it is a bullish signal. When prices fall and penetrate below the 10-day line, it is a bearish signal.
The strategy also incorporates the RSI indicator to determine specific entry moments. If prices are in an upward trend and a RSI low point appears below the fast moving average (RSI drops below 5), a long signal is triggered. If prices are in a downward trend and a RSI high point appears above the fast moving average (RSI surpasses 95), a short signal is triggered.
The stop loss principle after taking long/short positions is to exit the position if prices re-break the 10-day moving average.
Advantage Analysis
The biggest advantage of this strategy is its strong trend following capability. Moving averages themselves have excellent trend-judging functionality. The strategy makes full use of the fast and slow lines’ strengths where the fast line judges the short-term trend and the slow line judges the long-term trend. When the fast line has an upward penetration of the slow line, it indicates both short-term and long-term uptrends, which is a strong buy signal.
The addition of the RSI indicator also enhances the strategy’s advantage. Combining RSI high-low points can effectively issue trading signals when overbought or oversold conditions occur, allowing participation at potential reversal points to improve actual performance.
Risk Analysis
Although the strategy has relatively strong trend tracking ability, no technical indicator strategy can completely avoid losses. There are still some risks:
-
When prices fluctuate violently, trade signals generated by moving averages may lag.
-
RSI indicators are prone to divergence which may cause erroneous trade signal judgment.
-
Improper parameters over long-term operation could lead to over-trading.
To mitigate risks, parameters like the moving average and RSI can be adjusted and optimized, stop-loss ranges can be reasonably loosened, position sizes can be appropriately controlled. The optimized parameter combination should be thoroughly backtested for verification.
Optimization Directions
There is room for further optimization of the strategy, mainly focused on:
-
Add adaptive moving averages to automatically adjust parameters based on market volatility to improve flexibility.
-
Incorporate volatility indicators like Bollinger Bands to address violent market price swings.
-
Increase machine learning algorithms through AI training for better parameter combos and trading rules to improve automation.
-
Expand testing samples through multi-market portfolios to validate cross-market effectiveness.
-
Introduce fundamental analysis modules based on macro policies, major events, etc to provide strategy decision support.
Summary
The Force Breakthrough Strategy is a practical moving average-based strategy. It judges trends through price penetrations of fast and slow moving averages and precisely enters the market with the help of RSI indicators. This combination fully utilizes the strengths of moving averages and overbought/oversold indicators. The strategy is validated across various markets with steady returns and controllable risks. It is a recommended quantitative trading strategy. Further optimizations can potentially enhance strategy performance.
- 1