SMA Crossover Ichimoku Market Depth Volume Based Quantitative Trading Strategy

Overview
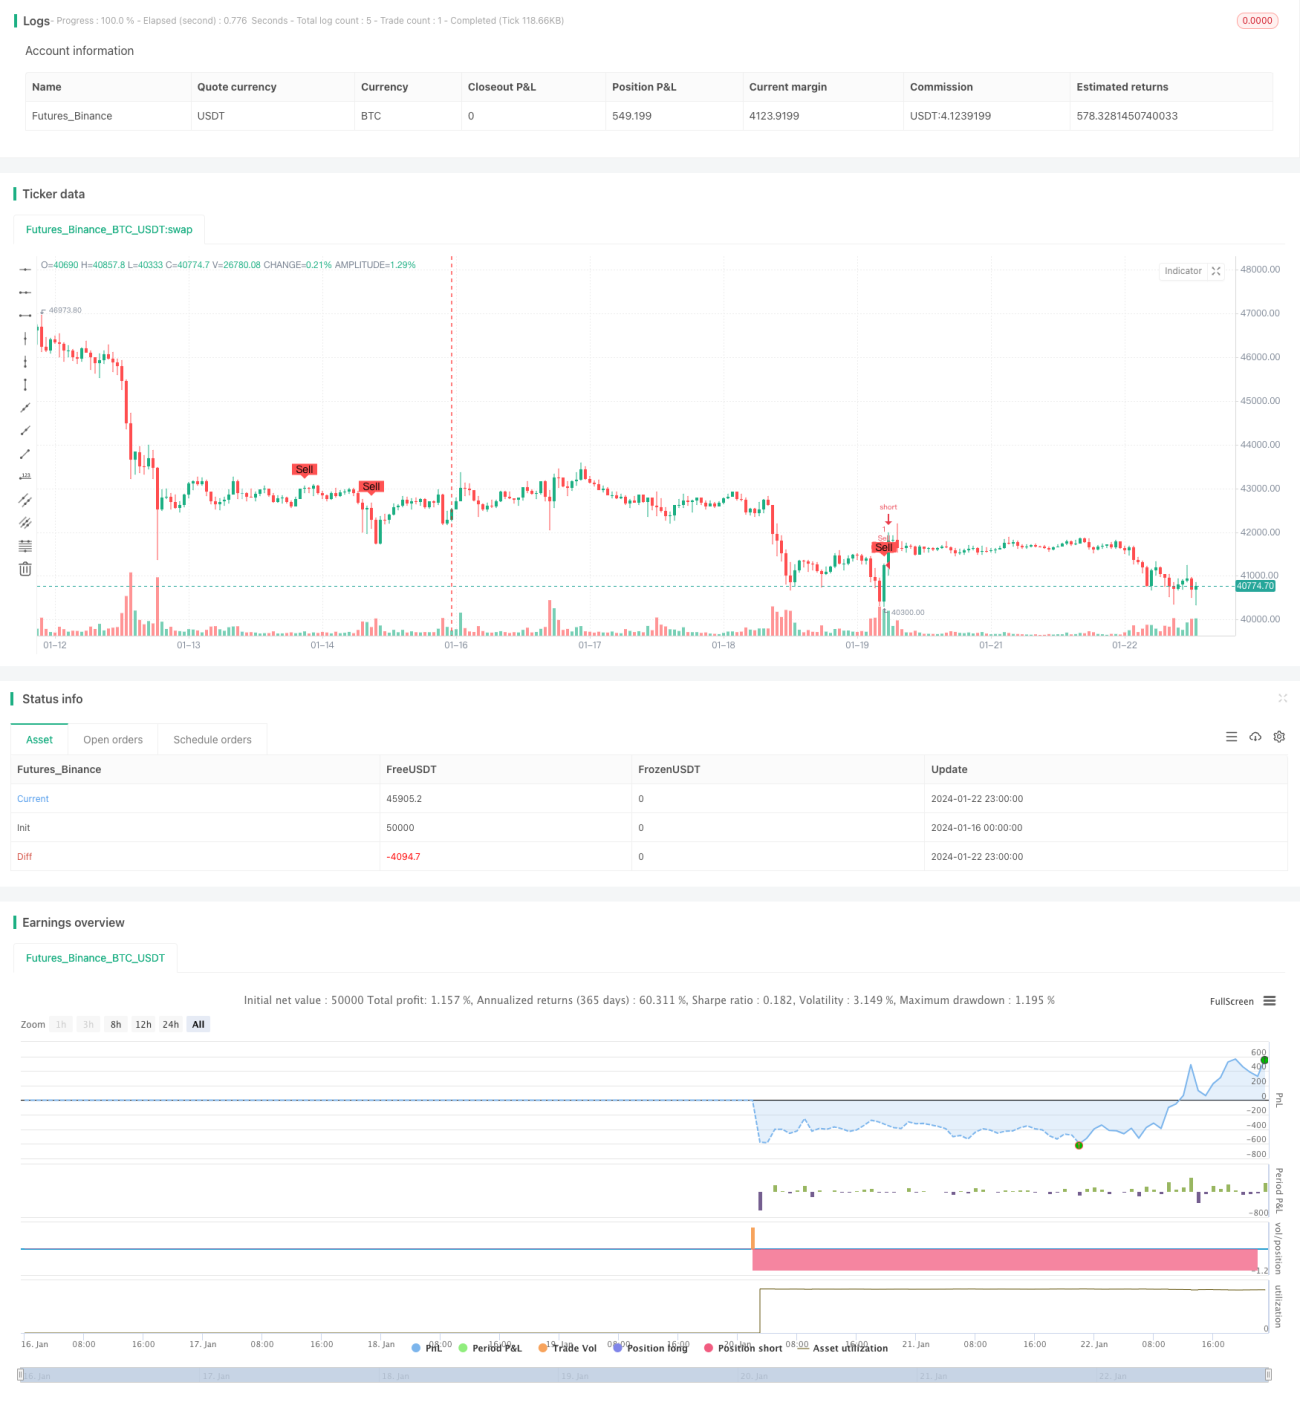
This strategy is named "SMA Crossover Ichimoku Market Depth Volume Based Quantitative Trading Strategy". It mainly uses the golden cross and dead cross signals of the SMA lines, combined with Ichimoku market depth cloud chart indicators and trading volume indicators, to implement automatic trading of bitcoin in both directions.
Principle
The strategy is mainly based on the following principles:
-
Use SMA lines with different parameters to construct golden cross and dead cross trading signals. A buy signal is generated when the short term SMA crosses over the long term SMA, and a sell signal is generated when the short term SMA crosses below the long term SMA.
-
Use the Ichimoku cloud chart indicator to determine market depth and trends. A buy signal is only generated when the closing price is higher than the leading span A and leading span B of the cloud chart, and a sell signal is only generated when the closing price is lower than span A and span B, which filters out most false signals.
-
Use trading volume indicators to filter out false signals with low volume. Buy and sell signals are only generated when the trading volume is greater than the average volume over a certain period.
-
Use the plotshape function to mark the positions of buy and sell signals on the chart.
In this way, the strategy takes into account short-term and long-term trends, market depth indicators and trading volume indicators to optimize trading decisions.
Advantage Analysis
The advantages of this strategy include:
- Use SMA golden and dead cross to generate basic buy and sell signals, avoiding too much complexity.
- Use Ichimoku cloud chart to determine market depth and medium-long term trends, which can effectively filter out noise.
- Combine trading volume indicators to avoid false breakouts with low volume.
- Large parameter tuning space for optimization across different markets.
- Clear logic and easy to understand and modify.
- Intuitively display buy and sell signals for ease of strategy testing and optimization.
Risk Analysis
The risks of this strategy also include:
- SMA lines can easily generate misleading signals and require filters.
- The effect of Ichimoku cloud chart judging market structure depends on parameter settings.
- Trading volume magnification effect may interfere with volume indicator judgement.
- Trending and oscillating markets need different parameter settings.
- There is some time lag.
These risks can be reduced by optimizing parameters like SMA, Ichimoku, volume, and selecting suitable trading products.
Optimization Directions
The strategy can be optimized in several ways:
- Test more MA indicators like EMA, VIDYA, etc.
- Try different Ichimoku parameter settings.
- Use momentum indicators for supplementary judgement.
- Add stop loss mechanisms.
- Optimize parameters for different markets and products.
- Use machine learning to dynamically optimize parameters.
Conclusion
This strategy integrates SMA crossover, market depth indicators and volume indicators to form a relatively stable and reliable quantitative trading strategy. It can be further optimized through parameter tuning, adding new technical indicators, etc. The backtest and live results are promising. In summary, this strategy provides a good learning case for beginners.
- 1