Bidirectional EMA Cross Quant Trading Strategy

Overview
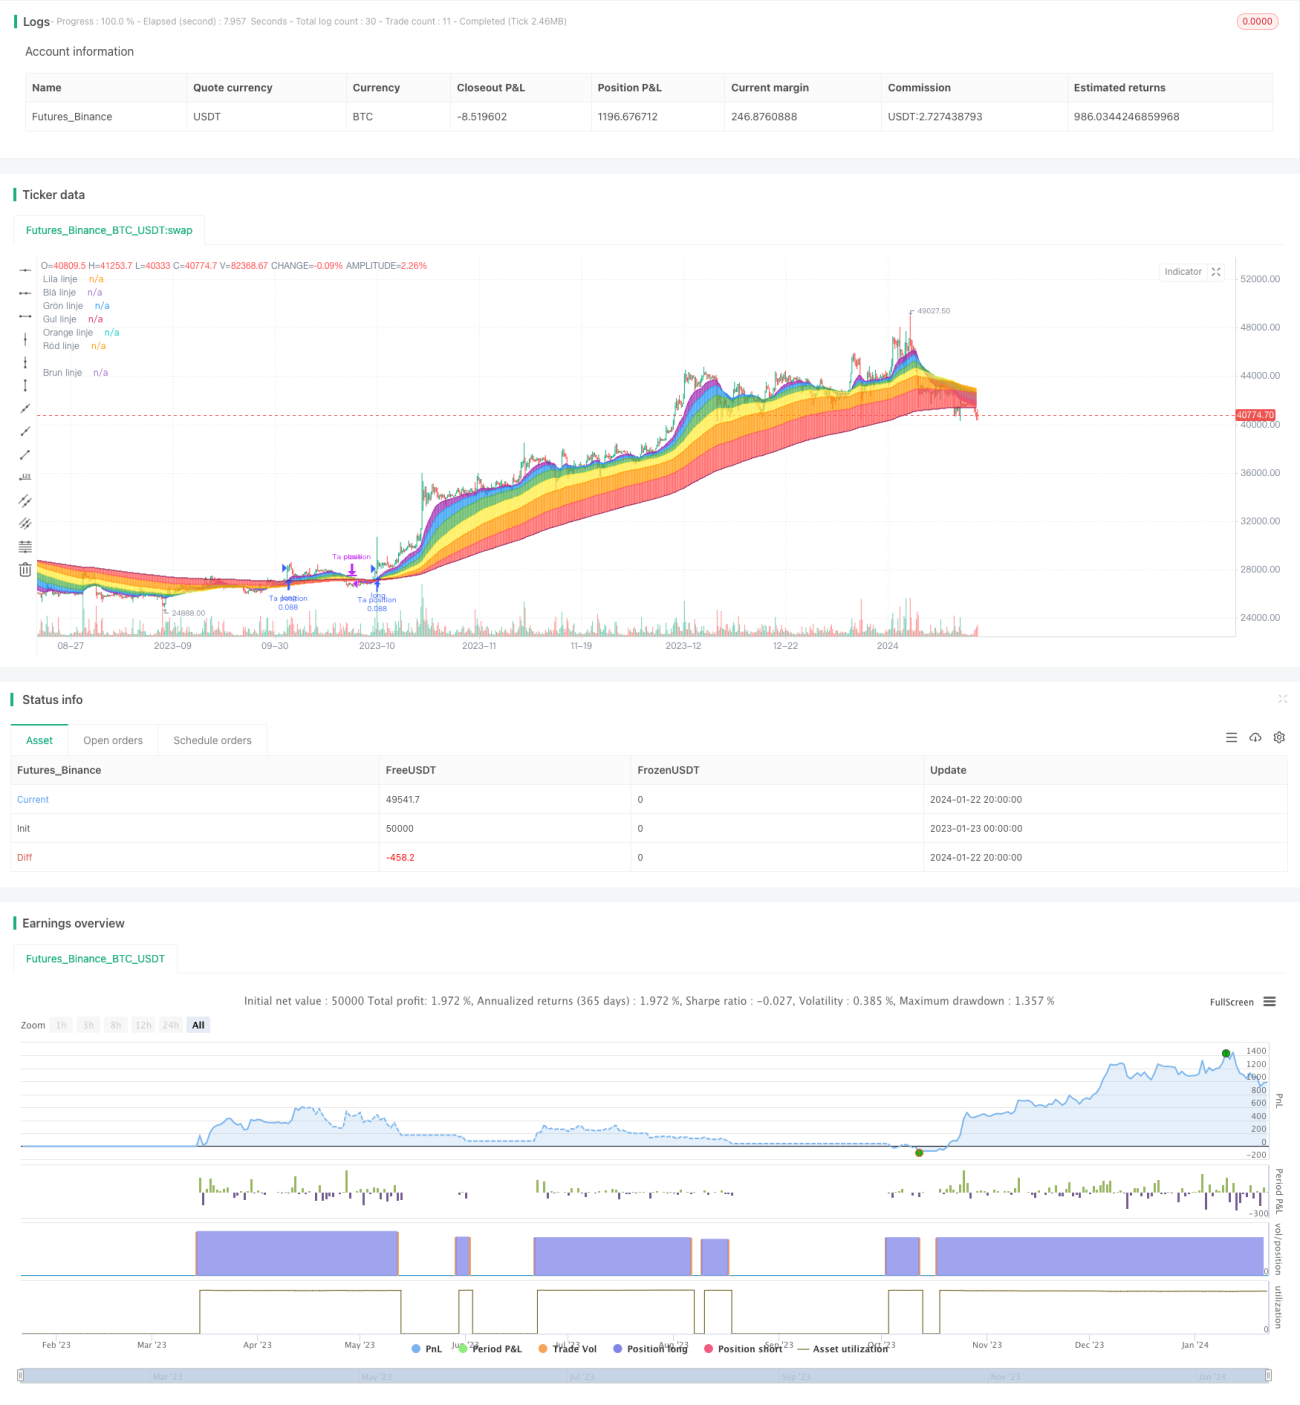
This strategy uses bidirectional EMA indicators to determine the main trend direction of the market, and combines the RSI indicator as the timing of entry selection, which belongs to the trend following algorithm trading strategy.
Strategy Principle
- Calculate multiple groups of EMA with different cycles to identify the main trend direction of the market in three dimensions: short-term, medium-term and long-term
- When the short-term EMA crosses above the medium-long term EMA, it is determined that a bullish trend has formed
- When the short-term EMA crosses below the medium-long term EMA, it is determined that a bearish trend has formed
- Combine the RSI indicator to find suitable entry timing. The RSI indicator can be used to determine overbought and oversold zones
- In an uptrend, go long when the RSI indicator is at low levels; In a downtrend, go short when the RSI indicator is at high levels
The above strategy mainly applies the bidirectional EMA indicator to determine the main trend direction, and uses the RSI indicator as the entry signal selection, which belongs to a typical trend following algorithm trading strategy.
Advantage Analysis
The biggest advantage of this strategy is that it can clearly determine the main trend direction of the market, and select a better entry timing based on the RSI indicator. Specific advantages are as follows:
- Use multiple sets of EMA to identify the main trend direction of the market under multiple time dimensions
- The EMA indicator calculation is simple with less noise, and it determines the main trend of the market accurately and reliably
- The RSI indicator can effectively determine entry and stop loss points to significantly optimize return retio
- The algorithm structure is clear and easy to understand and modify. It is a typical trend following strategy
- It can be flexibly combined with other technical indicators to further improve strategy performance
Risk Analysis
The strategy also has some risks, mainly in the following aspects:
- When the trend reverses, the stop loss point may be too idealized, thus increasing losses
- Unable to effectively determine the trend reversal point, possibly missing the opportunity to stop loss in time
- EMA parameters and RSI parameters need repeated testing and optimization, otherwise it may cause instability
- Cannot guarantee that every entry is the perfect timing, there may be unnecessary multiple repetitions
- It is difficult to effectively avoid major gaps under the influence of sudden events
To address the above risks, optimizations can be made in the following areas:
- Reasonably set stop loss points to prevent excessive losses
- Increase other indicators to determine trend reversal to ensure timely stop loss
- Optimize parameter combinations to adapt to wider market conditions
- Modify entry and stop loss logic to reduce the number of repetitions
- Increase exceptions judgment to avoid adverse effects of market gaps
Optimization Directions
From the advantages and risks of this strategy, we can get the following optimizable directions:
- On the existing bidirectional EMA framework, introduce indicators like MACD and BOLL for judging trend reversal points, thereby optimizing take profit and stop loss strategies
- Introduce machine learning models to predict trend reversal probability and further improve strategy performance
- Apply advanced filters to automatically identify abnormal market conditions and effectively prevent losses
- Use genetic algorithms, deep reinforcement learning and other methods to automatically optimize parameters so that strategies can adapt to more market types
- Add automatic stop loss module, can dynamically adjust stop loss points according to actual situation
Through introducing more indicators, prediction models, parameter optimization, risk control modules and other means, this strategy can be further improved to adapt to more complex and volatile market conditions.
Conclusion
This article detailed introduced the main content of the bidirectional EMA cross quantitative trading strategy. First, it outlined the main ideas and operating principles of the strategy. Then the advantages of the strategy were fully analyzed. At the same time, it also analyzed the main potential risks in the strategy. On this basis, several key optimizable directions were proposed. In summary, this strategy has the advantage of determining the main trend of the market, and also has some room for optimization, which is a typical quantitative trading strategy. Through continuous improvement and optimization, this strategy can become an important choice for investors' algorithmic trading.
/*backtest
start: 2023-01-23 00:00:00
end: 2024-01-23 00:00:00
period: 4h
basePeriod: 15m
exchanges: [{"eid":"Futures_Binance","currency":"BTC_USDT"}]
*/

// This source code is subject to the terms of the Mozilla Public License 2.0 at https://mozilla.org/MPL/2.0/
// © Investoz
// Indikatorn är byggd som ett utbildningsyfte och är därför ingen rekommendation för köp/sälj av aktier. Tanken är att skapa en visuell form i en graf
// som visar om det finns någon trend såväl positiv som negativ. En dialogruta med en varning talar om vilken trend som råder. I koden finns en möjlighet- 1