The RSI Divergence Indicator Strategy

Overview
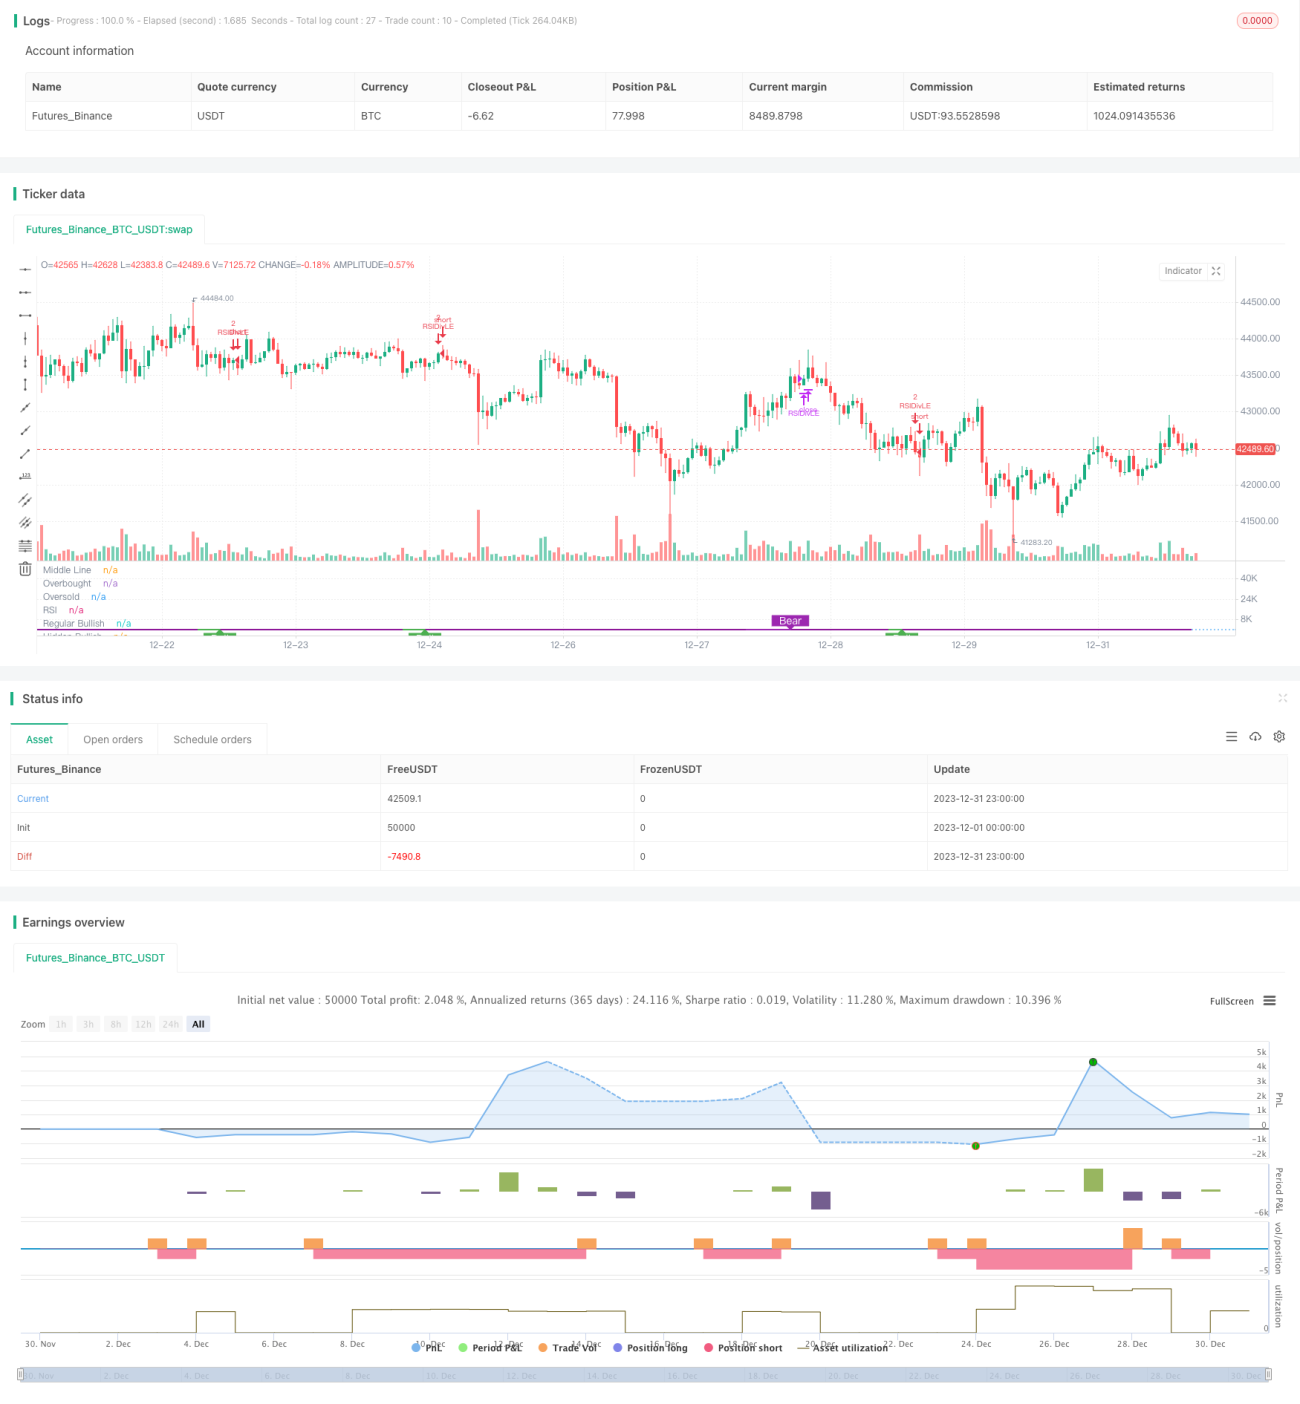
The RSI Divergence Indicator strategy is a quantitative trading strategy based on the Relative Strength Index (RSI) indicator. It detects opportunities for trend reversals by analyzing the divergence between the RSI indicator and price, aiming to buy low and sell high.
Strategy Logic
The core indicator of this strategy is RSI. It analyzes the "divergence" between the RSI indicator and price. The so-called "divergence" refers to the opposite signals between RSI and price.
Specifically, when the RSI forms a relatively lower low while the price forms a relatively higher low, it is a bullish divergence between the RSI and price. This implies that the price may reverse upwards. The strategy will establish a long position at this point.
Conversely, when the RSI forms a relatively higher high while the price forms a relatively lower high, it is a bearish divergence between the RSI and price. This implies that the price may reverse downwards. The strategy will establish a short position at this point.
By capturing these divergences between RSI and price, the strategy can timely detect opportunities for price reversals and achieve buying low and selling high.
Advantages
The RSI Divergence strategy has the following advantages:
-
Accurate in capturing price reversal points. Divergences between RSI and price often imply an upcoming trend reversal, which is a very effective predictive signal.
-
Achieve buying low and selling high. By establishing positions at divergence points, it is able to buy at relatively low prices and sell at relatively high prices, aligning with the best practices of quantitative trading.
-
Breakthrough the limitations of conventional RSI strategies. Conventional RSI strategies only focus on overbought and oversold areas. This strategy utilizes the intrinsic reversal properties of the RSI itself to capture turning points more precisely, greatly improving the efficiency of the strategy.
-
Simple parameter settings. The main parameters are just the RSI period and lookback period, which is very simple and easy to optimize.
Risks
The RSI Divergence strategy also has some risks:
-
Divergence signals could be false signals. The divergences between RSI and price do not necessarily lead to real price reversals. Sometimes they also form false reversals, leading to trading losses. Reasonable stop loss should be set to control risks.
-
Poor performance in trending markets. When the price shows a clear directional trend, the profit space of this strategy would be relatively small. It is better to temporarily disable the strategy in this case and wait for new ranging markets.
-
Risk of pyramiding. The strategy has set pyramiding parameters. In case of consecutive losing trades, it may accelerate the account drawdown. Position sizing and stop loss should be controlled to mitigate the risk.
Enhancements
The strategy can also be optimized in the following aspects:
-
Combine other indicators for signal filtering. MACD, KDJ and other indicators can be added to verify the RSI divergence points, filtering out some false signals and improving the win rate of the strategy.
-
Optimize RSI parameters. Different RSI periods can be tested to find the one that best matches the characteristics of the product. Generally between 6-15 works well.
-
Optimize lookback period. The lookback period directly affects the trading frequency of the strategy. Different values can be tested to find the optimal frequency, usually between 5-15 is a good range.
-
Add stop loss logic. Reasonable stop loss methods like ATR trailing stop loss can be implemented to quickly cut losses when incurred. This can effectively control the risk of the strategy.
Conclusion
The RSI Divergence strategy accurately captures price turning points by analyzing the intrinsic reversal properties of the RSI indicator itself. It achieves a low-buy-high-sell trading approach. Compared to the traditional overbought-oversold RSI strategies, it utilizes more refined and intrinsic characteristics of RSI, greatly improving efficiency. With parameter optimization and risk control, it is very suitable for capturing short-term trading opportunities within ranging markets.
/*backtest
start: 2023-12-01 00:00:00
end: 2023-12-31 23:59:59
period: 1h
basePeriod: 15m
exchanges: [{"eid":"Futures_Binance","currency":"BTC_USDT"}]
*/

//@version=4
//study(title="Divergence Indicator", format=format.price)
//GOOGL setting  5 , close, 3 , 1  profitLevel at 75 shows win rate  87.21 %  profit factor 7.059
//GOOGL setting 8 , close, 3 , 1 profitLevel at 80 shows win rate 86.57 % profit factor 18.96 - 1