Trend Tracking Moving Average Crossover Strategy

Overview
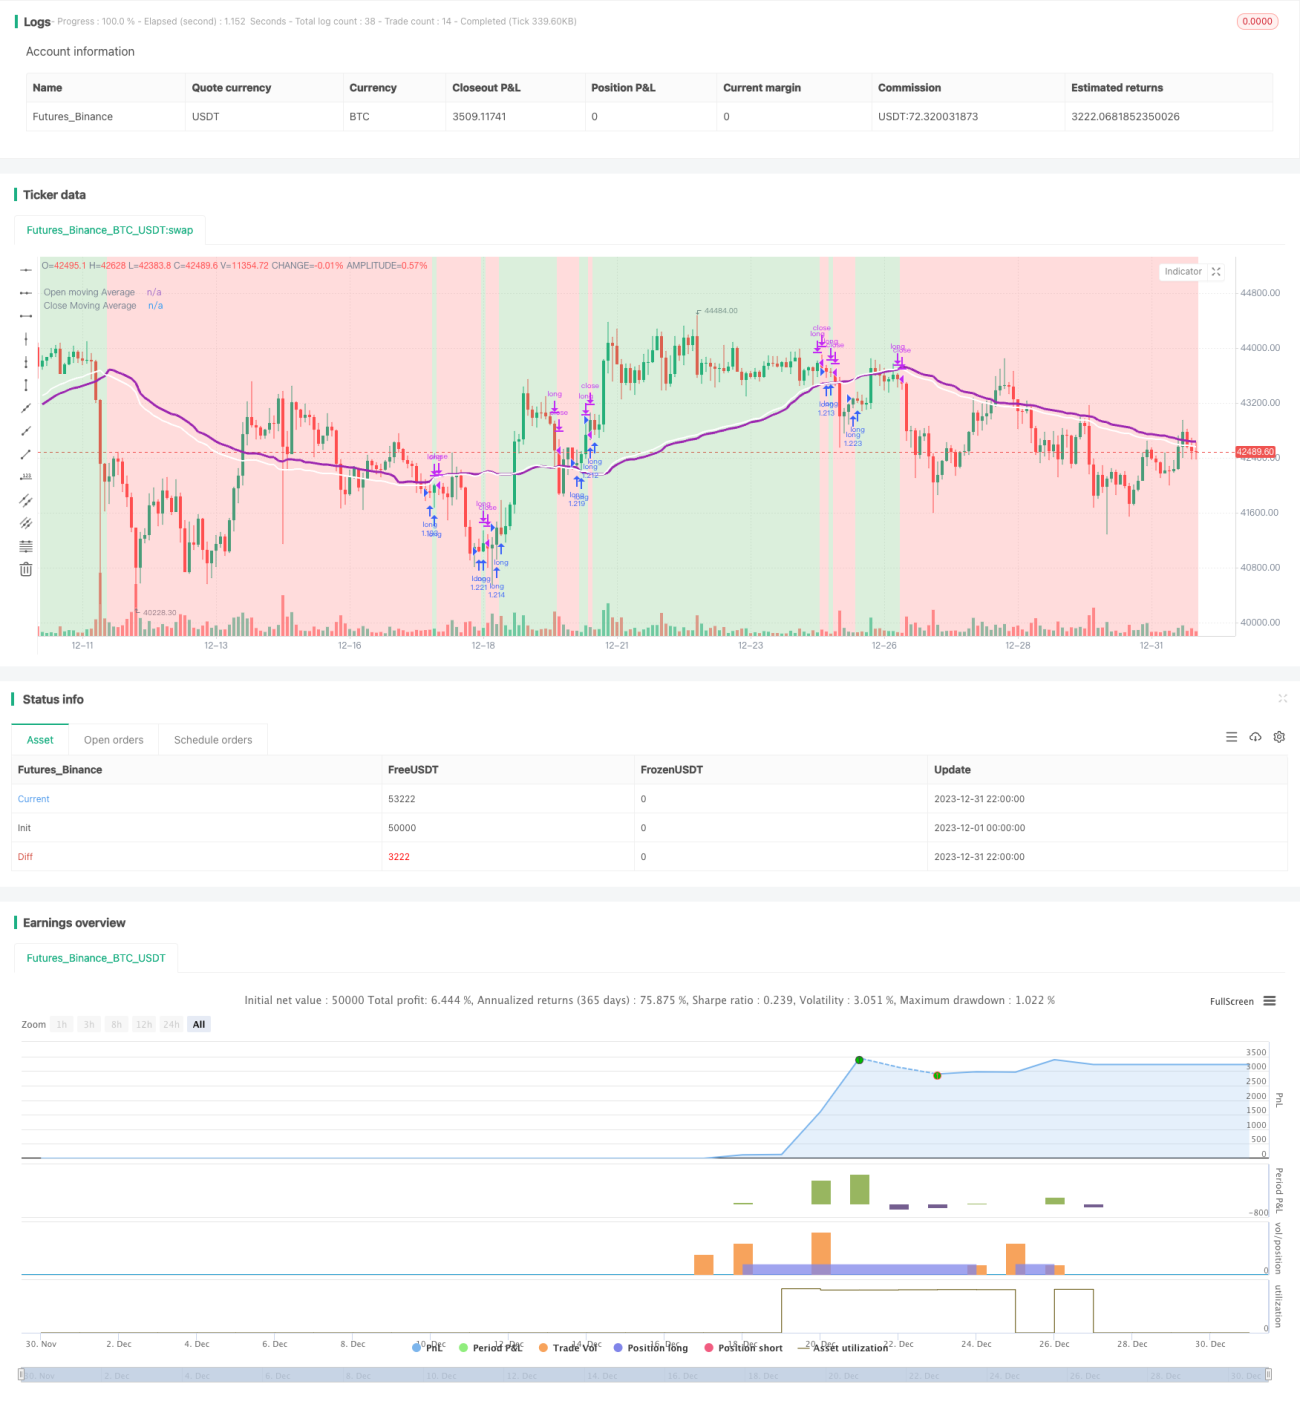
This is a simple moving average based strategy that works well with different coin pairs. It plots the moving average opening price and closing price, and decides to enter a long position or exit it based on whether the two lines have crossed each other. The idea is that it enters a position when the average closing price is increasing, which may indicate upward momentum in prices. It then exits the position when the average closing price decreases, which may indicate downward momentum. This is speculative, but sometimes it can predict price action very well.
Strategy Logic
This strategy first selects the type of moving average, including EMA, SMA, RMA, WMA and VWMA. Then it sets the lookback period for the moving average, usually between 10 and 250 bars. Different combinations of moving average type and lookback period can produce very different results for different coin pairs.
The specific trading logic is:
- Calculate the moving average of open price and close price;
- Compare the moving average values between close price and open price;
- Enter a long position if close price moving average crosses above open price moving average;
- Close the long position if close price moving average crosses below open price moving average.
Entering the position considers it a sign of upward price movement, while exiting considers downward price movement.
Advantage Analysis
The main advantages of this strategy are:
- Flexible parameter settings that can be optimized for different coin pairs for better specificity;
- Simple logic that is easy to understand and implement;
- Very high returns achievable for some coin pairs, generally good stability;
- High customizability in displaying different indicators.
Risk Analysis
There are also some risks with this strategy:
- For some coin pairs and parameters, returns and stability can be low;
- Cannot respond well to short-term price fluctuations, poor performance for high volatile coins;
- Choice of moving average lookback period not scientific enough, somewhat subjective.
Solutions and optimization:
- Use longer timeframes like 12H, 1D to reduce unnecessary trades and improve stability;
- Add parameter optimization functions to automatically test different parameter combinations for best parameters;
- Add adaptive selection of moving average lookback period to let system automatically decide optimal period.
Conclusion
In summary, this is a simple strategy using moving average indicators to determine price trend and inflection points. It can achieve very good results by adjusting parameters, and is an effective trend tracking strategy worth further improvement and application. But risk management should be noted, choose suitable coin pairs and parameters to maximize its usefulness.
- 1