Overview
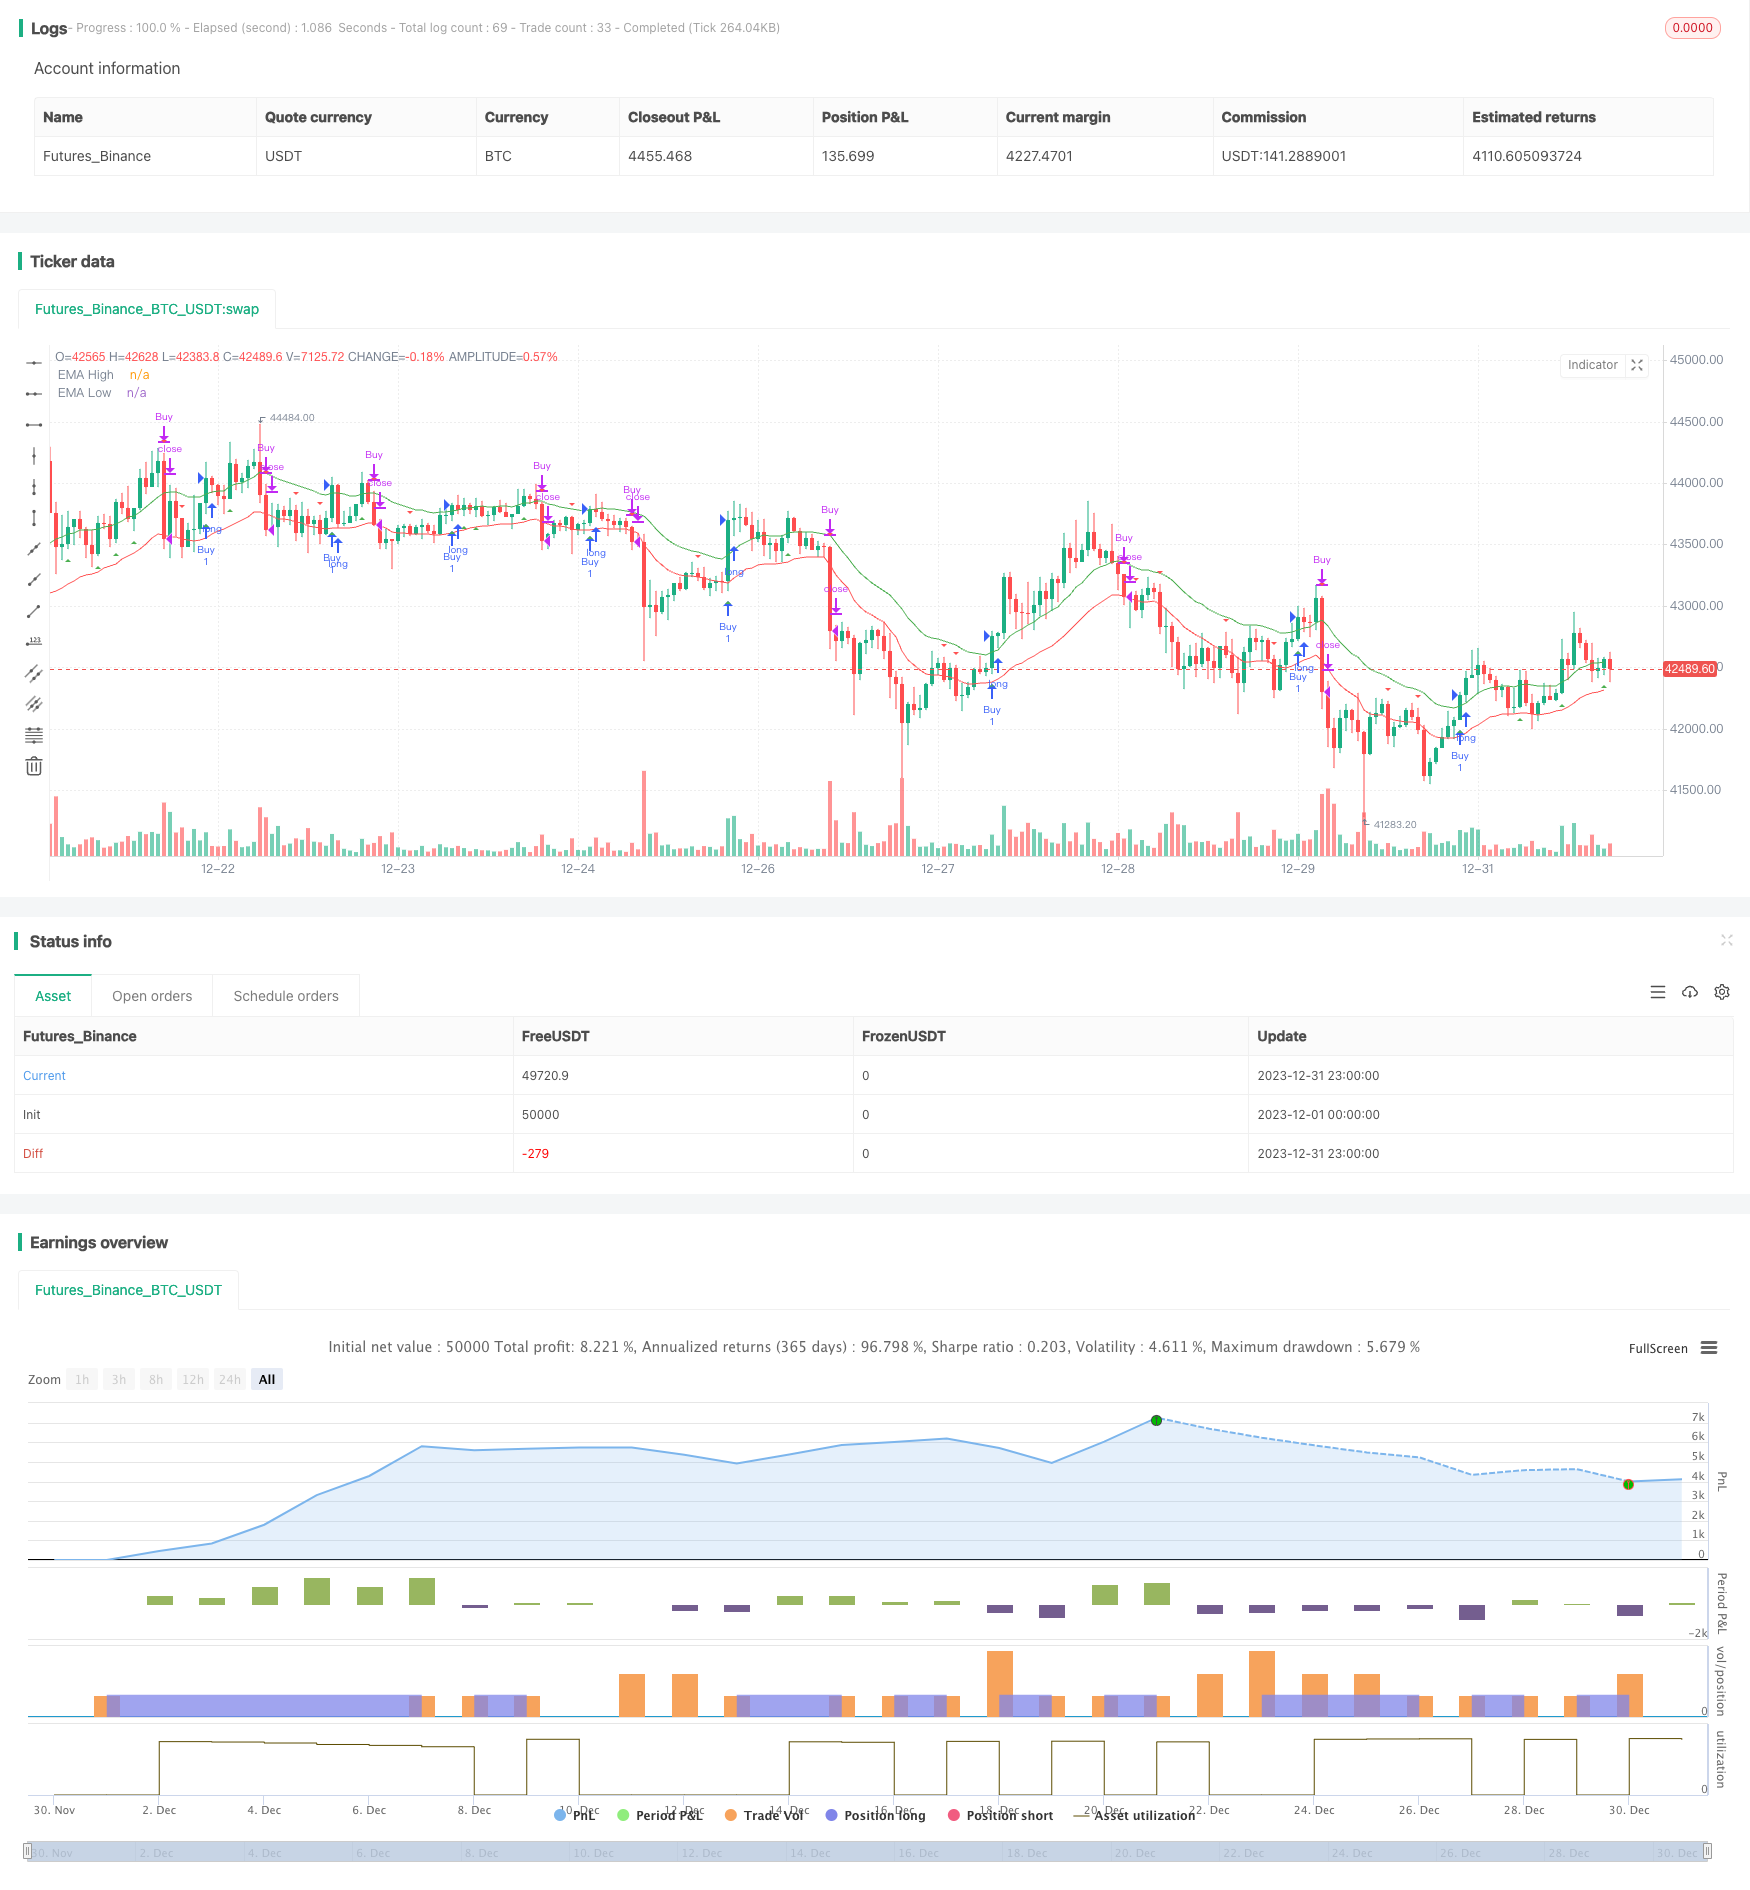
This strategy builds a channel based on 20-day Exponential Moving Average (EMA) lines, goes long when price breaks through the upper band and goes short when price breaks through the lower band. It belongs to trend following strategies.
Strategy Logic
- Calculate 20-day EMA high and low to build the channel.
- Go long when close price is above 20-day EMA high.
- Go short when close price is below 20-day EMA low.
- Set stop loss to the other side of the channel, e.g. 20-day EMA low for long trade.
Advantage Analysis
- EMA channel effectively tracks the trend.
- 20-day EMA parameter is simple and practical.
- Breakout signals help reduce wrong trades.
- Stop loss setting reasonably controls risks.
Risk Analysis
- Breakout signals may have false positives.
- Prone to be stopped out in range-bound market.
- Improper parameters lead to oversensitivity or sluggishness.
Risk Management:
- Add filters with other indicators.
- Optimize parameters for different cycles.
- Trade cautiously and manage capital carefully.
Optimization
- Add filters with volume or momentum indicators.
- Test effectiveness of different EMA periods.
- Add trailing stop to lock in profits.
- Combine volatility measures for trend strength.
Summary
This is a simple and practical strategy building EMA channel for trend following. It has breakout signals but also risks of false signals. The strategy can be improved by optimizing parameters and adding filters. Worth further testing and enhancement.
Strategy source code
/*backtest
start: 2023-12-01 00:00:00
end: 2023-12-31 23:59:59
period: 1h
basePeriod: 15m
exchanges: [{"eid":"Futures_Binance","currency":"BTC_USDT"}]
*/

//@version=4
strategy("EMA Channel Strategy with Alerts", shorttitle="EMA Channel", overlay=true)

// Define EMA length
emaLength = 20

// Calculate EMA values
emaHigh = ema(high, emaLength)
emaLow = ema(low, emaLength)

// Define the condition for a buy signal
buyCondition = crossover(close, emaHigh)

// Define the condition for a sell signal
sellCondition = crossunder(close, emaLow)

// Plot the EMA lines
plot(emaHigh, color=color.green, title="EMA High")
plot(emaLow, color=color.red, title="EMA Low")

// Plot buy and sell signals
plotshape(buyCondition, style=shape.triangleup, location=location.belowbar, color=color.green, title="Buy Signal")
plotshape(sellCondition, style=shape.triangledown, location=location.abovebar, color=color.red, title="Sell Signal")

// Strategy
strategy.entry("Buy", strategy.long, when=buyCondition)
strategy.close("Buy", when=sellCondition)

// Define and trigger alerts
alertcondition(buyCondition, title="Buy Alert", message="Buy signal - Price crossed above EMA High")
alertcondition(sellCondition, title="Sell Alert", message="Sell signal - Price crossed below EMA Low")