Multi-factor Quantitative Trading Strategy

Overview
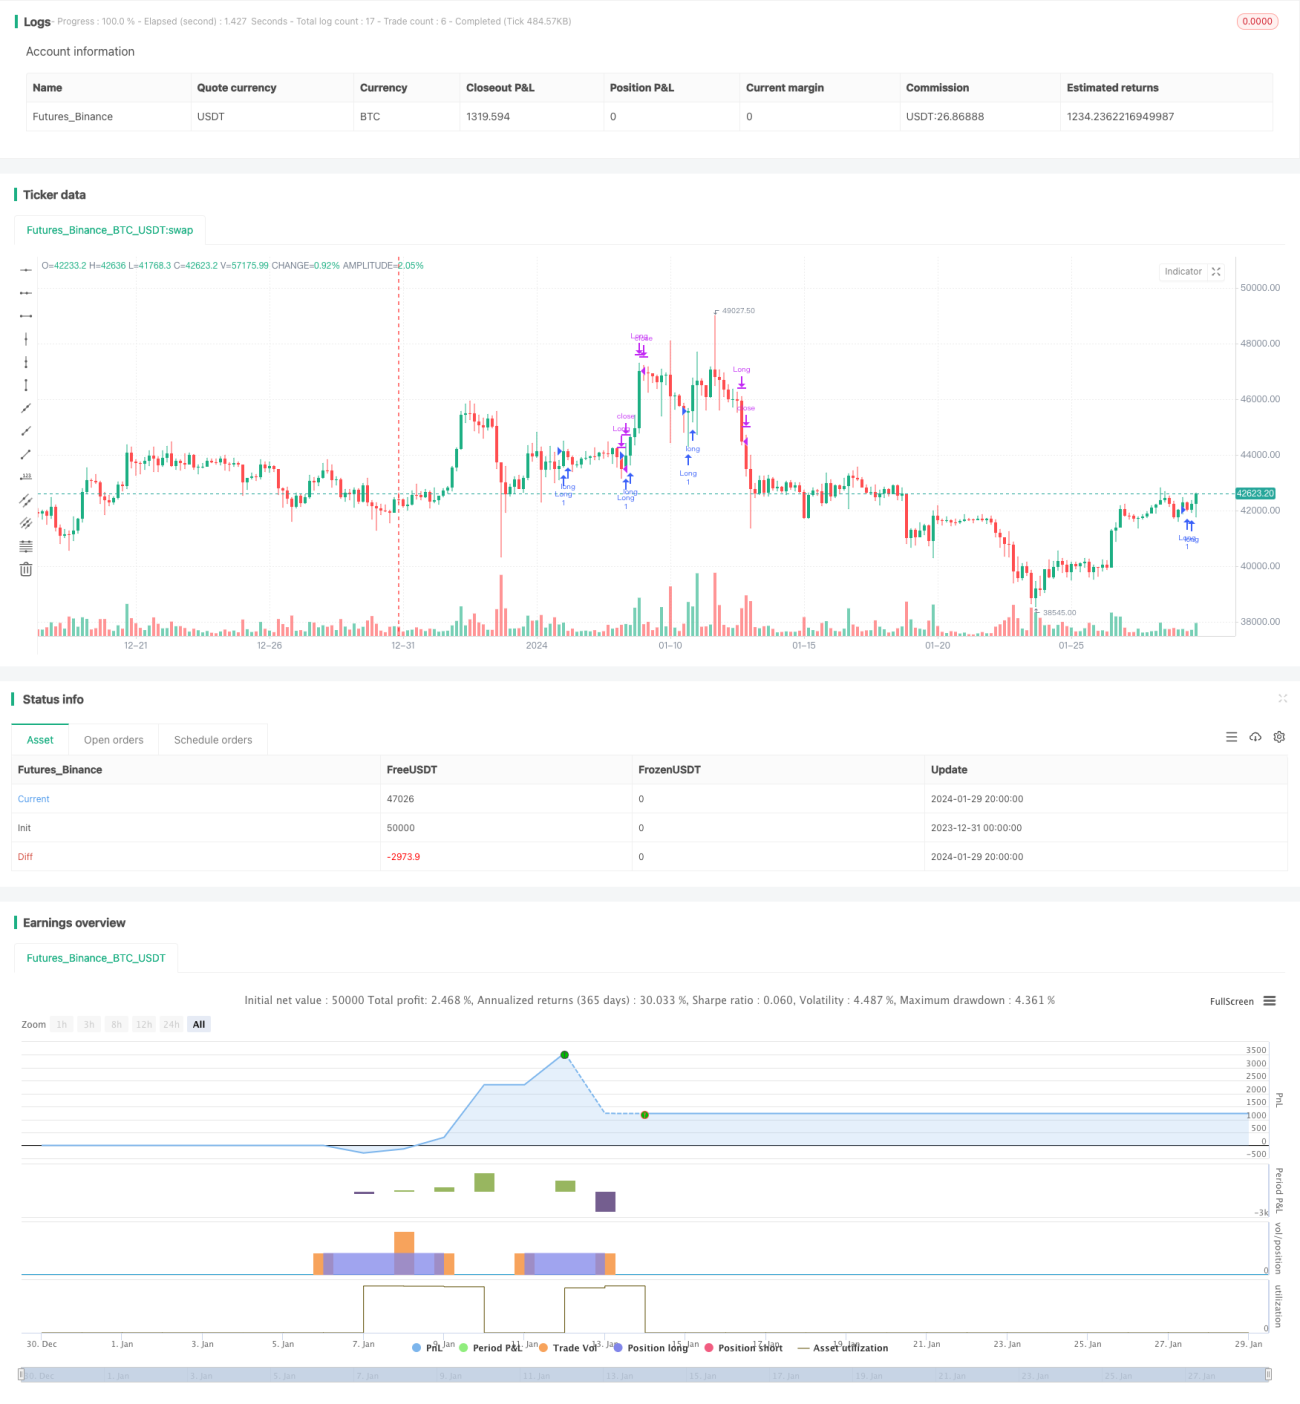
This is a quantitative trading strategy that incorporates multiple technical indicators. It combines moving averages, MACD, Bollinger Bands, RSI and other indicators to implement a multi-factor model driven automated trading.
Strategy Logic
The trading signals of this strategy come from the following parts:
- Golden cross and death cross of dual moving averages
- MACD zero line crossovers
- Bollinger Bands upper and lower rail reversals
- RSI overbought and oversold reversals
When the above indicators simultaneously issue buy or sell signals, the strategy will make corresponding long or short decisions.
Specifically, when the fast moving average crosses over the slow one, MACD histograms start to increase, RSI bounces up from oversold zone, and price approaches the Bollinger Bands lower rail, it's considered as a trend reversal signal for long entry.
And when the fast MA crosses below the slow MA, MACD histograms begin to decline, RSI drops from overbought area, and price reaches the upper Bollinger Bands, it's regarded as a short-term top reversal for short entry.
By combining signals from multiple indicators, fake signals can be filtered out effectively and the stability of the strategy can be improved.
Advantage Analysis
The biggest advantage of this strategy is that it adopts a multi-factor model for trading, which enhances the reliability of signals, stability and profitability of the strategy.
-
The multi-factor model can verify trading signals with each other and reduce interference from fake signals effectively.
-
Indicators from different categories can capture more comprehensive characteristics of market movements and make more accurate judgements.
-
The combination of multiple indicators can smooth out fluctuations of individual ones and ensure more steady returns.
-
The indicators and their weights in the combination can be flexibly adjusted to tailor the strategy for different market conditions.
Risk Analysis
Some risks of this strategy should be concerned:
-
The complex combination of multiple indicators requires precise parameter tuning and testing, otherwise it may produce invalid signals.
-
The performance on a single product may not be stable enough. A portfolio consisting of suitable products should be constructed to diversify risks.
-
Position sizing and stop loss mechanisms should be strictly controlled to limit losses under extreme market conditions.
Optimization Directions
Some directions this strategy can be optimized:
-
Test combinations of more indicators to find out the optimal parameters, such as implied volatility, volume etc.
-
Utilize machine learning methods to automatically generate optimal combinations of indicators and parameter sets.
-
Do more backtests and optimization on longer time frames, adjust weights accordingly for different market stages.
-
Incorporate risk management tools to control losses on single trades and overall positions strictly.
Conclusion
This strategy makes full use of advantages of different technical indicators and forms a multi-factor model, which improves the accuracy of signals effectively. Meanwhile, risk control, parameters tuning and strategy updating are also vital to keep improving the stability and profitability.
/*backtest
start: 2023-12-31 00:00:00
end: 2024-01-30 00:00:00
period: 4h
basePeriod: 15m
exchanges: [{"eid":"Futures_Binance","currency":"BTC_USDT"}]
*/

//@version=5
strategy("Математическая Торговая Система с Ишимоку, TP/SL, ADX, RSI, OBV", shorttitle="МТС Ишимоку TP/SL ADX RSI OBV", overlay=true)

is_short_enable = input(0, title="Короткие сделки")- 1