RSI Trend Following Strategy with Trailing Stop Loss

Overview
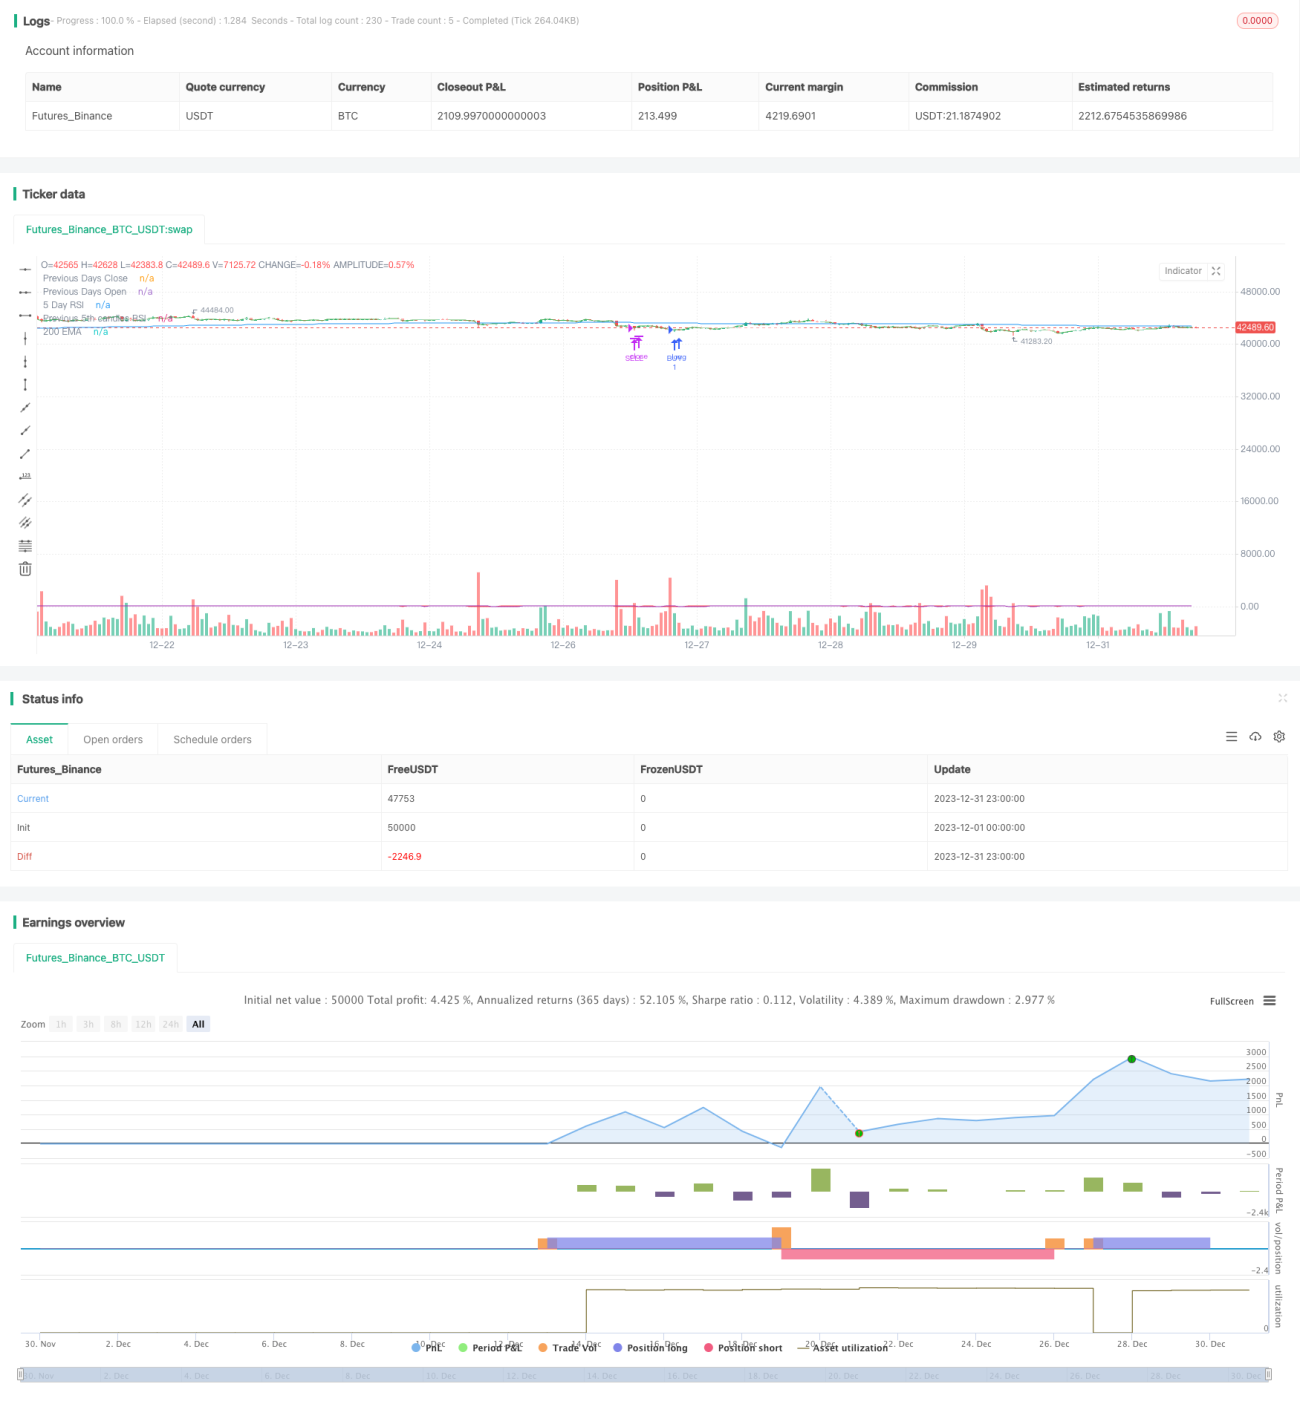
This is a quantitative trading strategy that utilizes the RSI indicator to determine the market trend and sets stop loss and take profit to lock in profits and minimize risks.
Strategy Logic
The strategy mainly uses the RSI indicator to determine the market trend direction for long or short trades. When the RSI line crosses above the lower line, it is determined as an upward trend and goes long. When the RSI line crosses below the upper line, it is judged as a downward trend and goes short.
At the same time, the strategy tracks the entry price of each order and sets a floating stop loss and take profit. For long orders, a certain percentage of the entry price is set as the stop loss line, and for short orders, a certain percentage of the entry price is set as the take profit line. When the price hits the stop loss or take profit line, the position will be closed automatically.
Advantages
- Use RSI indicator to determine market trend, avoid trading in range-bound markets;
- Set floating stop loss and take profit to lock in profits flexibly and control risks effectively;
- RSI parameters and stop loss/take profit ratios are adjustable for optimization.
Risks
- RSI indicator has some lagging, may miss short-term trend reversal points;
- Stop loss and take profit lines that are too close may get hit easily.
Optimization
- Test RSI indicators with different periods;
- Test different parameter combinations to find the optimal stop loss/take profit ratios;
- Add additional indicators for signal filtering.
Conclusion
In summary, this is a quantitative trading strategy that uses RSI indicator to track trends and incorporate floating stop loss and take profit. Compared to single indicator strategies, this strategy manages risks quite well by locking in profits flexibly. Further improvements can be made through parameters optimization and adding auxiliary indicators.
- 1