Quantitative Candlestick Pattern and Trend Following Strategy

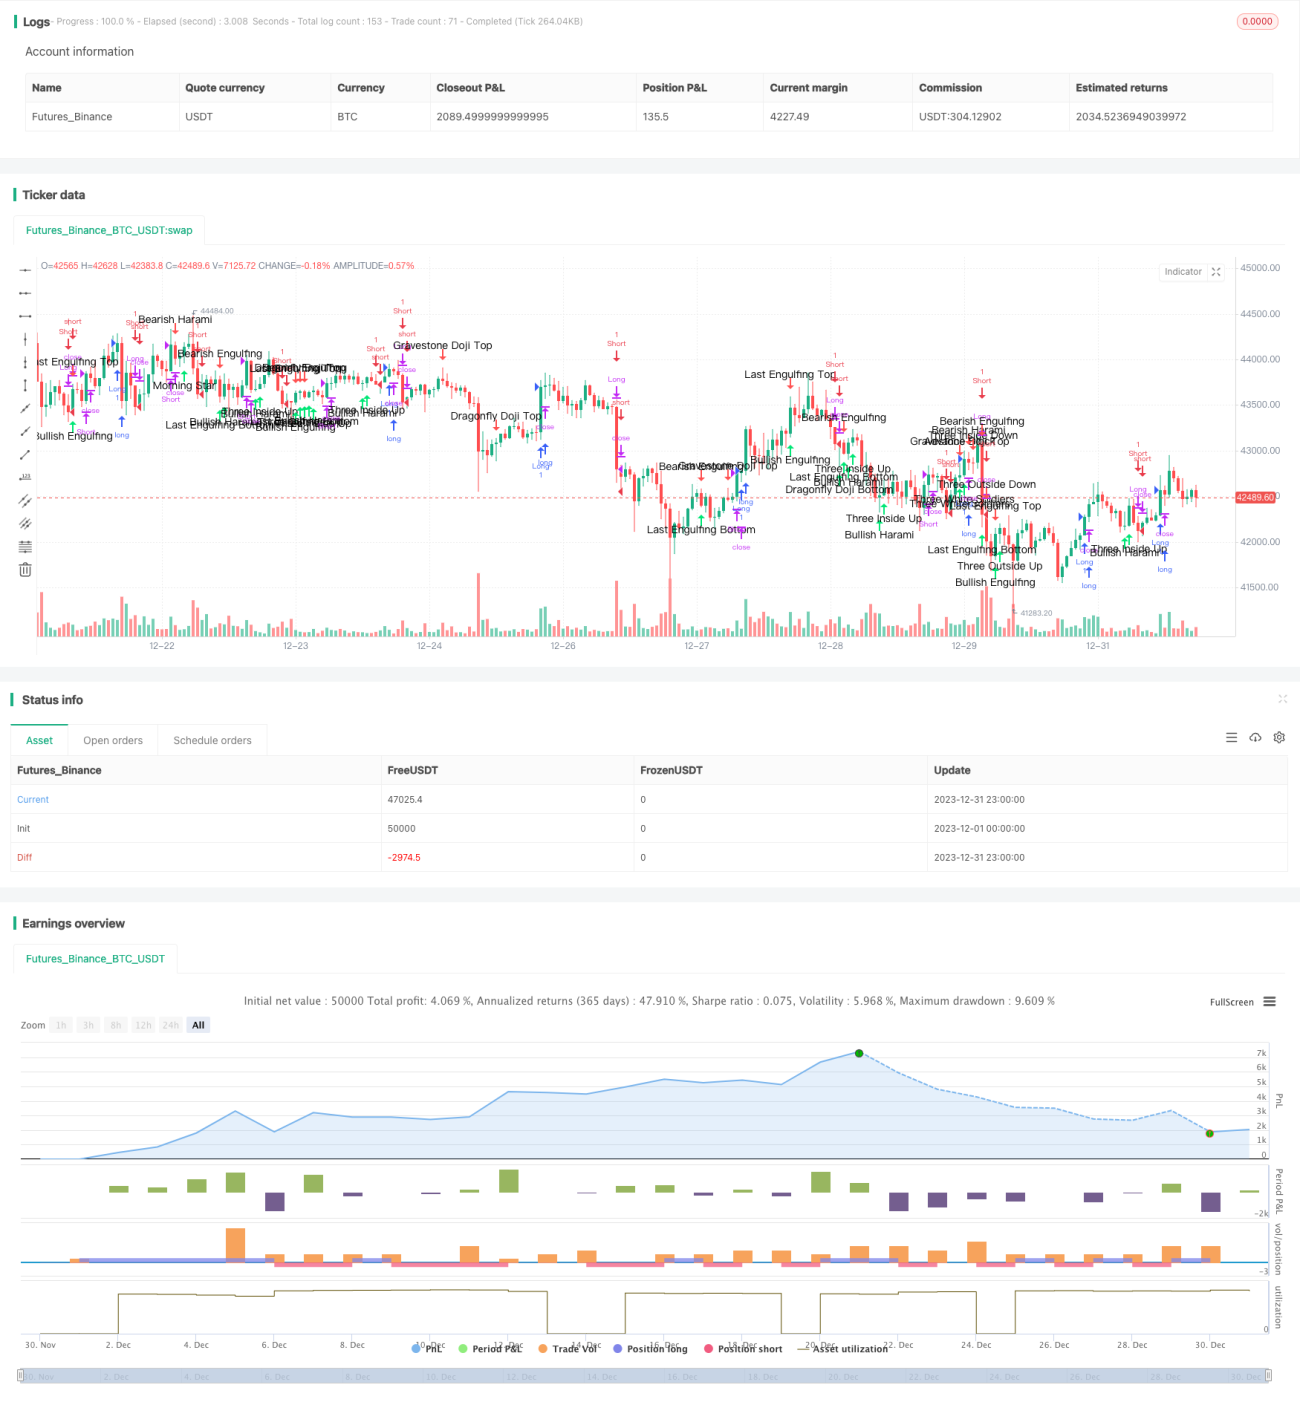
Overview
The strategy is named "Quantitative Candlestick Pattern and Trend Following Strategy". It integrates the strategy ideas of candlestick pattern analysis and trend following trading.
The strategy mainly identifies different candlestick patterns to judge the current market sentiment and potential turning points. Combined with tracking the highest and lowest prices to form entry and exit signals and capture mid-to-long term price trends.
Strategy Principle
The main modules of this strategy are:
-
Candlestick Pattern Identification
The strategy first defines elements on the candlestick like the body, shadow, and sets some parameters to identify over 40 common candlestick patterns like Doji, Morning Star, Three Inside Up, etc. When these patterns are identified, marks will be plotted and judged as bullish or bearish signals.
-
Trend Identification
The strategy utilizes the tracking of highest and lowest prices in N days to determine the trend. When price breaks above the highest price in N days, it is judged as an uptrend. When price breaks below the lowest price in N days, it is judged as a downtrend.
-
Entry and Exit
According to the bullish/bearish signals from candlestick pattern identification and the breakthrough of highest/lowest prices from trend identification, the strategy forms the entry and exit rules.
For example, when a bullish pattern like Hammer is identified and price breaks above the N-day highest price, go long. When price breaks below the N-day lowest price, close the long position.
-
Backtest Range Setting
At last, the strategy sets the start and end time for backtest to complete the whole logical loop.
Advantage Analysis
The advantages of this strategy:
-
Combination of Pattern and Trend
Utilize both pattern identification and trend following, it can spot potential turning points through patterns and determine entry timing according to trends.
-
Broad Pattern Coverage
The strategy covers over 40 common candlestick patterns, which provides wider coverage in different market environments for more potential trading opportunities.
-
High Parameter Tunability
The parameters like tracking days, pattern identification parameters are adjustable for users. It has better adaptivity and easier to tune for specific markets.
-
Easy to Expand
It's easy to expand with more pattern identifications based on existing logic or add in more factors to further optimize the strategy performance.
Risk Analysis
The main risks of the strategy:
-
Accuracy of Pattern Identification
Candlestick pattern identification does not provide 100% accuracy, there are still probabilities of misidentification and wrong signal triggering.
-
Lack of Stop Loss Module
Currently there is no stop loss logic in the strategy, unable to control losses of single trades effectively. It may lead to huge losses when trend identification fails.
-
Data Fitting Risk of Backtest
The current good results may have some data fitting risks towards the backtest data. Real trading performance may see a decrease.
Optimization Directions
The main optimization directions:
-
Add in Stop Loss Module
Add in modules like moving stop loss, percentage stop loss etc. to effectively control risks and limit max loss per trade.
-
Utilize Machine Learning to Improve Accuracy of Pattern Identification
Use machine learning algorithms to train models and improve accuracy of candlestick pattern identification, decrease misidentified signals.
-
Multi-Market Validation
Test the robustness of strategy on more markets like forex, crypto to avoid data fitting risks on single backtest.
-
Introduce More Factors
Bring in more quant factors like volume-price indicators, money flow indicators to enrich strategy logic and improve stability.
Conclusion
Overall, this strategy combines candlestick pattern identification and trend following trading to spot potential turning points and capture price trends simultaneously to achieve alpha. There are ample optimization space from risk control, machine learning models to multi-factor models to make it more robust and valuable for actual trading.
/*backtest
start: 2023-12-01 00:00:00
end: 2023-12-31 23:59:59
period: 1h
basePeriod: 15m
exchanges: [{"eid":"Futures_Binance","currency":"BTC_USDT"}]
*/

//@version=3
strategy("Candle analysis & long/short strategy (HF) inspired by TurtleBC", shorttitle="TurtleBC-V.Troussel", overlay=true,initial_capital=1000)

//VARIABLES- 1