Stop Loss and Take Profit Strategy Based on Doji Pattern

Overview
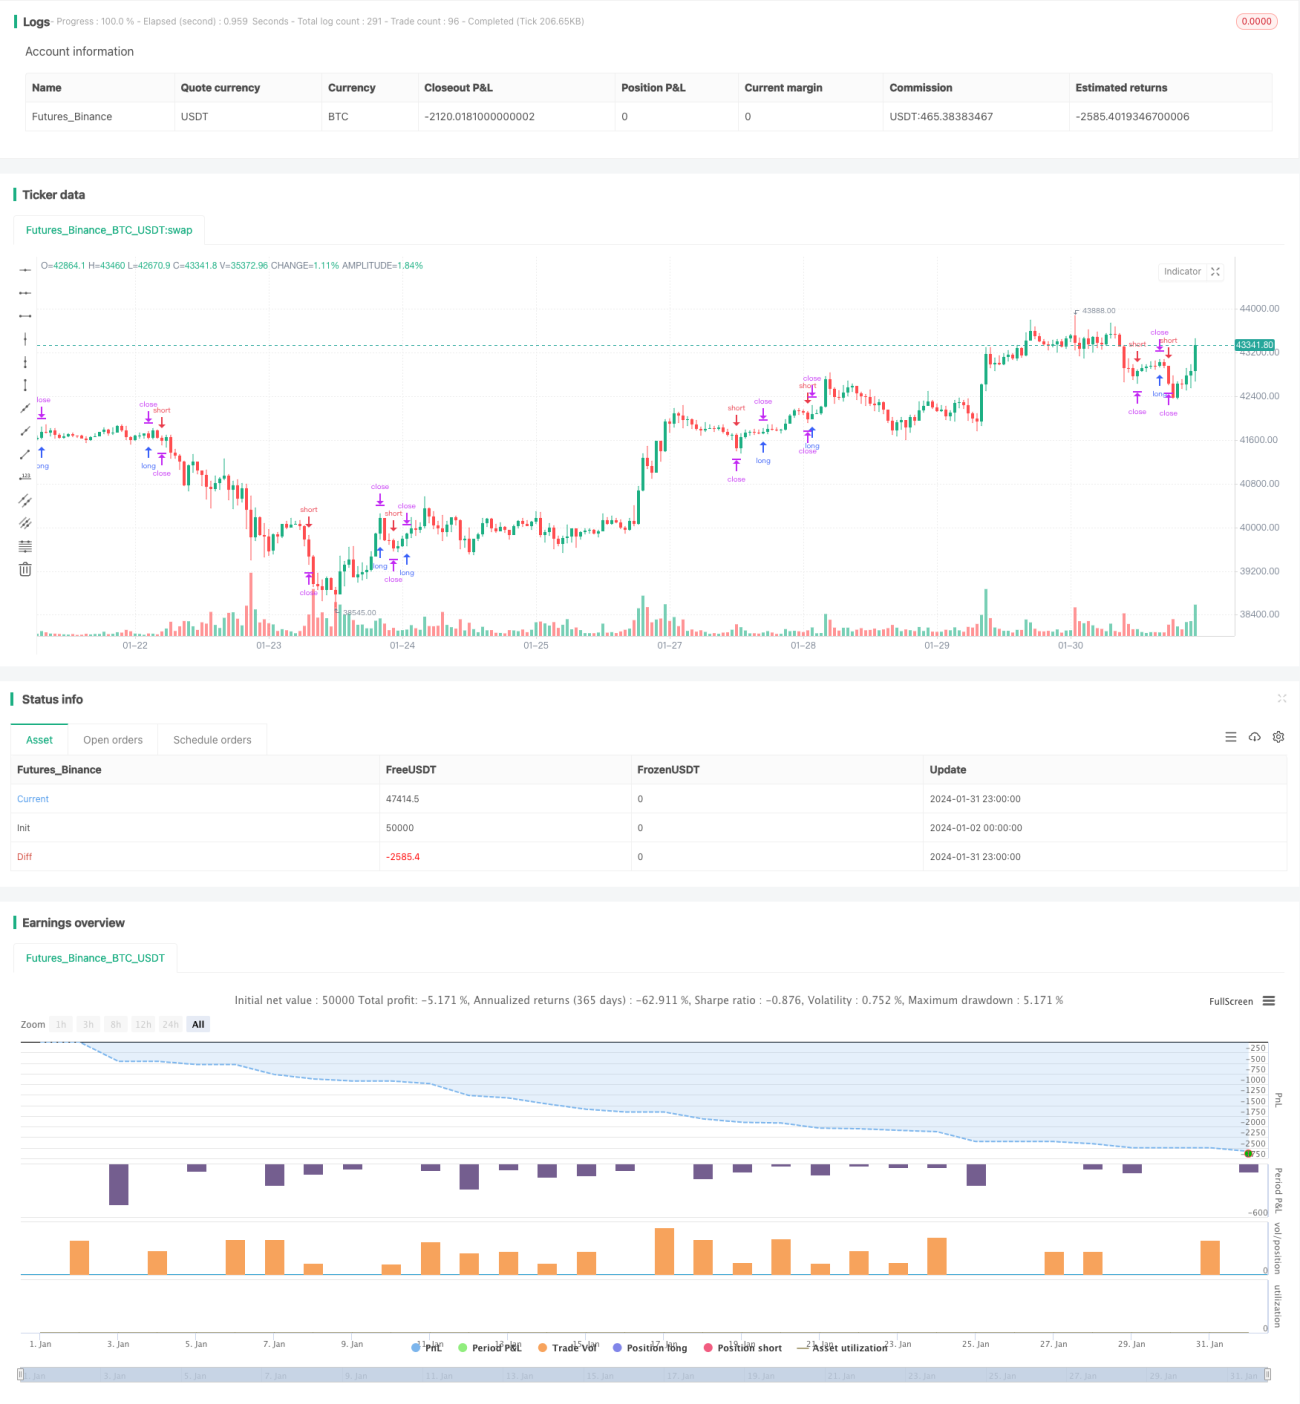
This strategy is based on the Doji pattern. When a Doji pattern appears, a buy stop order is placed between the high of the Doji and the high of the previous candle, and a sell stop order is placed between the low of the Doji and the low of the previous candle. When the price triggers the stop orders, you can choose to exit with fixed stop loss and take profit, or use the highest and lowest price of the Doji pattern as stop loss and take profit. This strategy works well on higher timeframes like daily and weekly to filter out noise.
Strategy Logic
When a Doji pattern appears, it indicates a change in the supply and demand relationship, with forces becoming more balanced, which may lead to a price reversal. This strategy takes advantage of the price reversal signal indicated by Doji to capture opportunities through stop orders. Specifically, the criteria for determining a Doji pattern is:
body=close-open
range=high-low
abody=abs(body)
ratio=abody/range
data=(abs(open - close) <= (high - low) * Doji)
If abs(open-close) <= (high-low)*Doji parameter, it is considered a Doji pattern, and stop orders will be placed. The position of the stop orders is:
            longDist= longcandle[1] and range[1]>range? high: max(high,high[1])
shortDist= longcandle[1] and range[1]>range? low: min(low,low[1])
If the body of the previous candle is large, the buy stop order is placed between the high of the Doji and the high of the previous candle. If the previous candle has a small body, the buy stop order is placed at the high of the Doji. The sell stop order follows the same logic.
There are two options for exits:
- Fixed stop loss and take profit
strategy.exit("exit buy","buy stop",loss=SL, profit=TP, when=Use_SL_TP)
- Use highest and lowest price of Doji as stop loss and take profit
strategy.close("buy stop",when=not Use_SL_TP and close<dojilow)
Advantage Analysis
The advantages of this strategy are:
- Simple to implement.
- Takes advantage of efficient price reversal signals from Doji pattern.
- Customizable stop loss and take profit parameters to control risk.
- Works well on higher timeframes to filter out noise.
Risk Analysis
There are some risks with this strategy:
- Doji pattern does not always lead to price reversal, may face stop loss. Solution is to reasonably set stop loss distance to limit loss per trade.
- Too much noise in Doji signals on lower timeframes. Should only run on higher timeframes like daily and weekly.
- Risk of unlimited losses without stop loss and take profit. Must use them properly.
Optimization Directions
Some ways to optimize the strategy:
- Optimize Doji parameter for different trading instruments.
- Test different combinations of stop loss and take profit.
- Dynamic stop loss based on ATR.
- Combine with other indicators to determine optimal entry.
Conclusion
The overall performance of this strategy is good. By capturing Doji price reversal opportunities, it can generate decent trading signals. Also simple to implement and applicable across multiple instruments. With continuous testing and optimizations, better results can be expected.
/*backtest
start: 2024-01-02 00:00:00
end: 2024-02-01 00:00:00
period: 1h
basePeriod: 15m
exchanges: [{"eid":"Futures_Binance","currency":"BTC_USDT"}]
*/

//@version=3
//This is a simple strategy based on Doji star candlestick
//It places two orders: buy stop at doji star high or previous candle high and sell stop at doji star low or previous candle low.
//This strategy works very well with high time frames like Weekly TF because it eliminates the noise in doji formation.- 1