Dual MA Indicator Oscillating Price Tracking Strategy

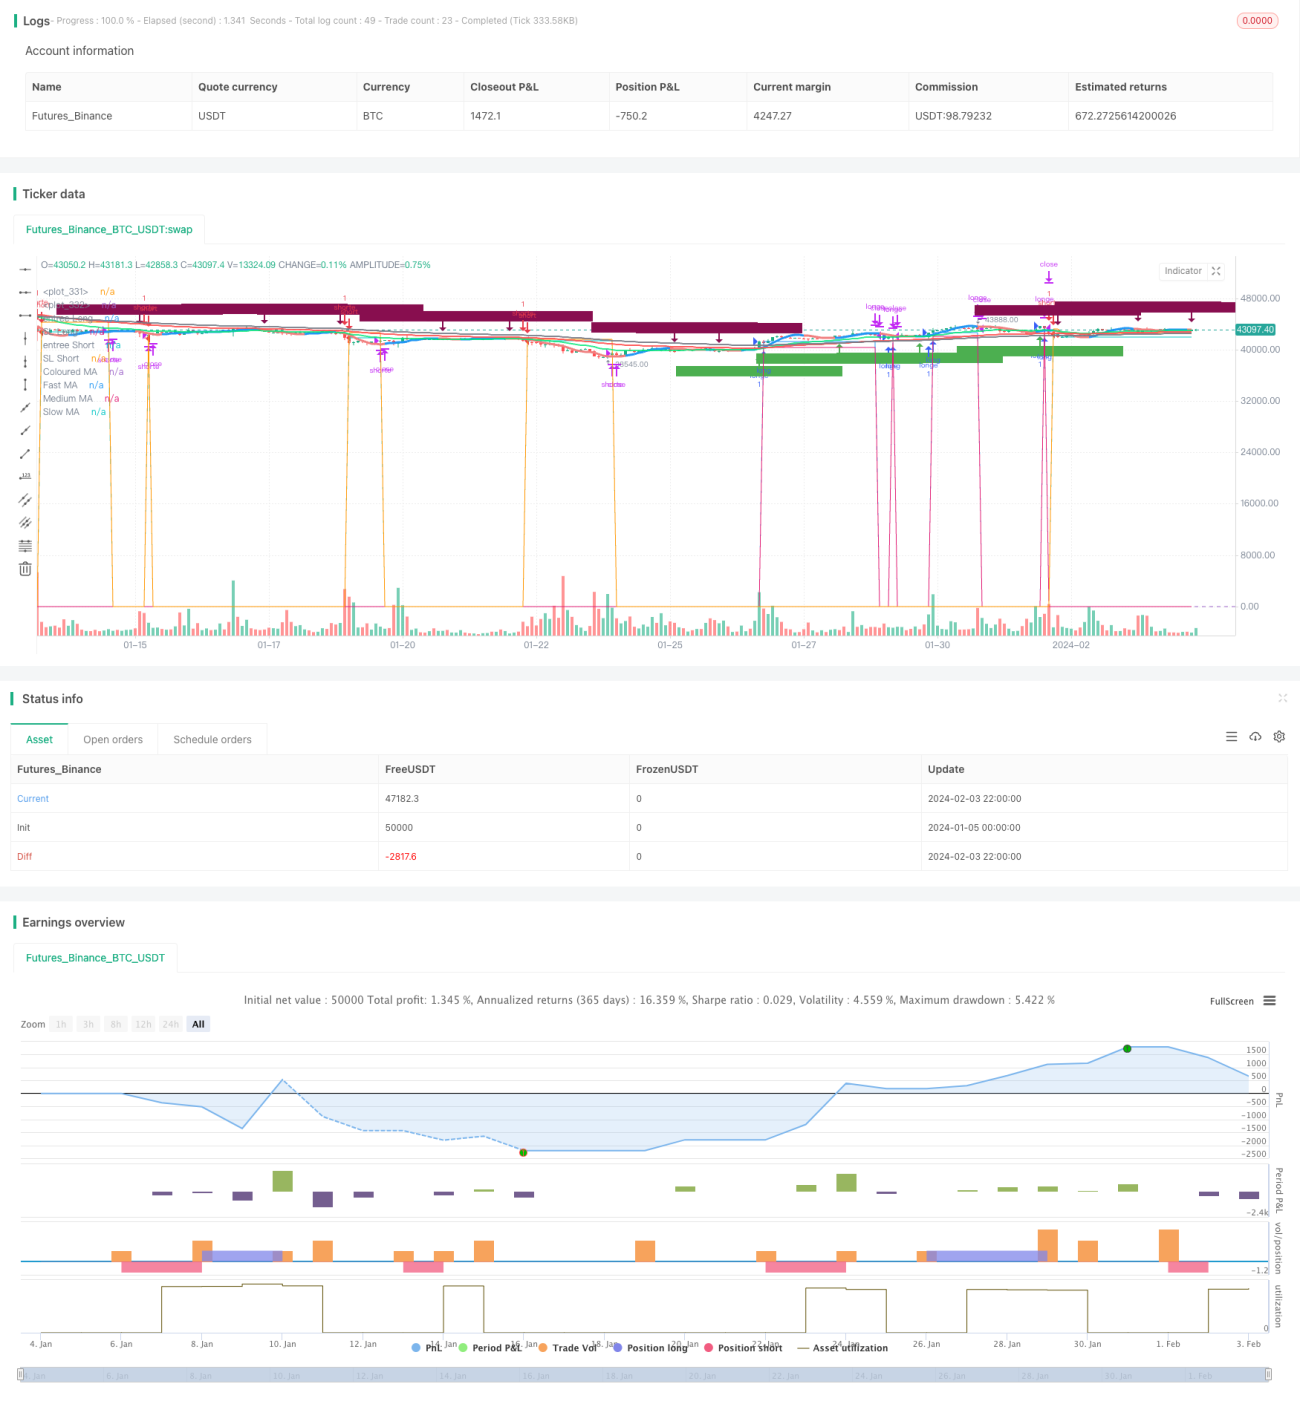
The strategy is named "Dual MA Indicator Oscillating Price Tracking Strategy". It utilizes the combination of SMA, EMA and other MA moving averages to track market prices in real time. When there is oscillation in the market, it can give trading signals.
Strategy Overview:
The strategy builds three groups of MA indicator lines with different parameters, representing the fast, medium and slow trends of the market. Meanwhile, filter indicators are used to filter out false signals and form the basis for long and short judgments. The strategy has diverse logical optimization and filtering methods, using technical indicators such as moving average crossovers, RSI overbought and oversold, and Bollinger Bands breakouts for composite judgment. It can effectively determine the buying and selling points of price extremes and capture oscillating trends while reducing market risks. The strategy has significant advantages.
Strategy Principles:
- Set up a group of fast (21 periods), medium (55 periods) and slow (89 periods) three MA indicator lines representing average price levels of different time lengths;
- Determine whether the current trend is in an upward or downward phase by judging the arrangement relationship of the three MA indicator lines (fast > medium > slow or fast < medium < slow);
- Assist with judgments such as SuperTrend to increase signal accuracy;
- Issue buy/sell signals based on changes in the status of these signals and filter indicators.
Advantages of the Strategy:
- Use multiple MA combinations to judge long and short term market trends for more accurate judgments;
- Adopt multiple filtering methods to optimize the selection of buying and selling points and increase profit probability;
- Apply technical indicators such as Bollinger Bands and RSI to assist breakouts and grasp key support levels and reversal opportunities;
- Select the buying and selling direction according to the direction change of the fast MA without the need to be greedy for reversals, chase oscillating trends, and achieve profits;
- Trading signals displayed clearly through visualizable arrows and markings, easy to grasp and convenient to operate.
Risks and Prevention:
- MA strategies have weaker resistance to false breakout probabilities;
- There may be time differences between combined indicators, leading to lagging signal risks;
- After a break-in buy, further judgment of the strength of the subsequent market is needed to prevent being trapped;
- Consider adding stop loss and take profit in live trading to control maximum loss per trade.
Strategy Optimization:
- Test different types and parameters of MA to find the optimal combination;
- Enhance reversal judgment modules such as improving the use of the KD indicator;
- Incorporate trading volume indicators to determine true trends;
- Expand BIAS indicators to determine overbought and oversold areas.
Conclusion:
In the ever-fluctuating cryptocurrency market, this strategy takes the opportunity to make frequent trades during the ups and downs of market waves. By setting the MA indicators and auxiliary filtering judgments for switching between long and short positions, it grasps the key reversal timing of the market. It can also be further optimized by adding stop loss modules to reduce single losses and obtain long-term positive returns through strategy automation.
- 1