Trend Following Strategy Based on EMA Lines

Overview
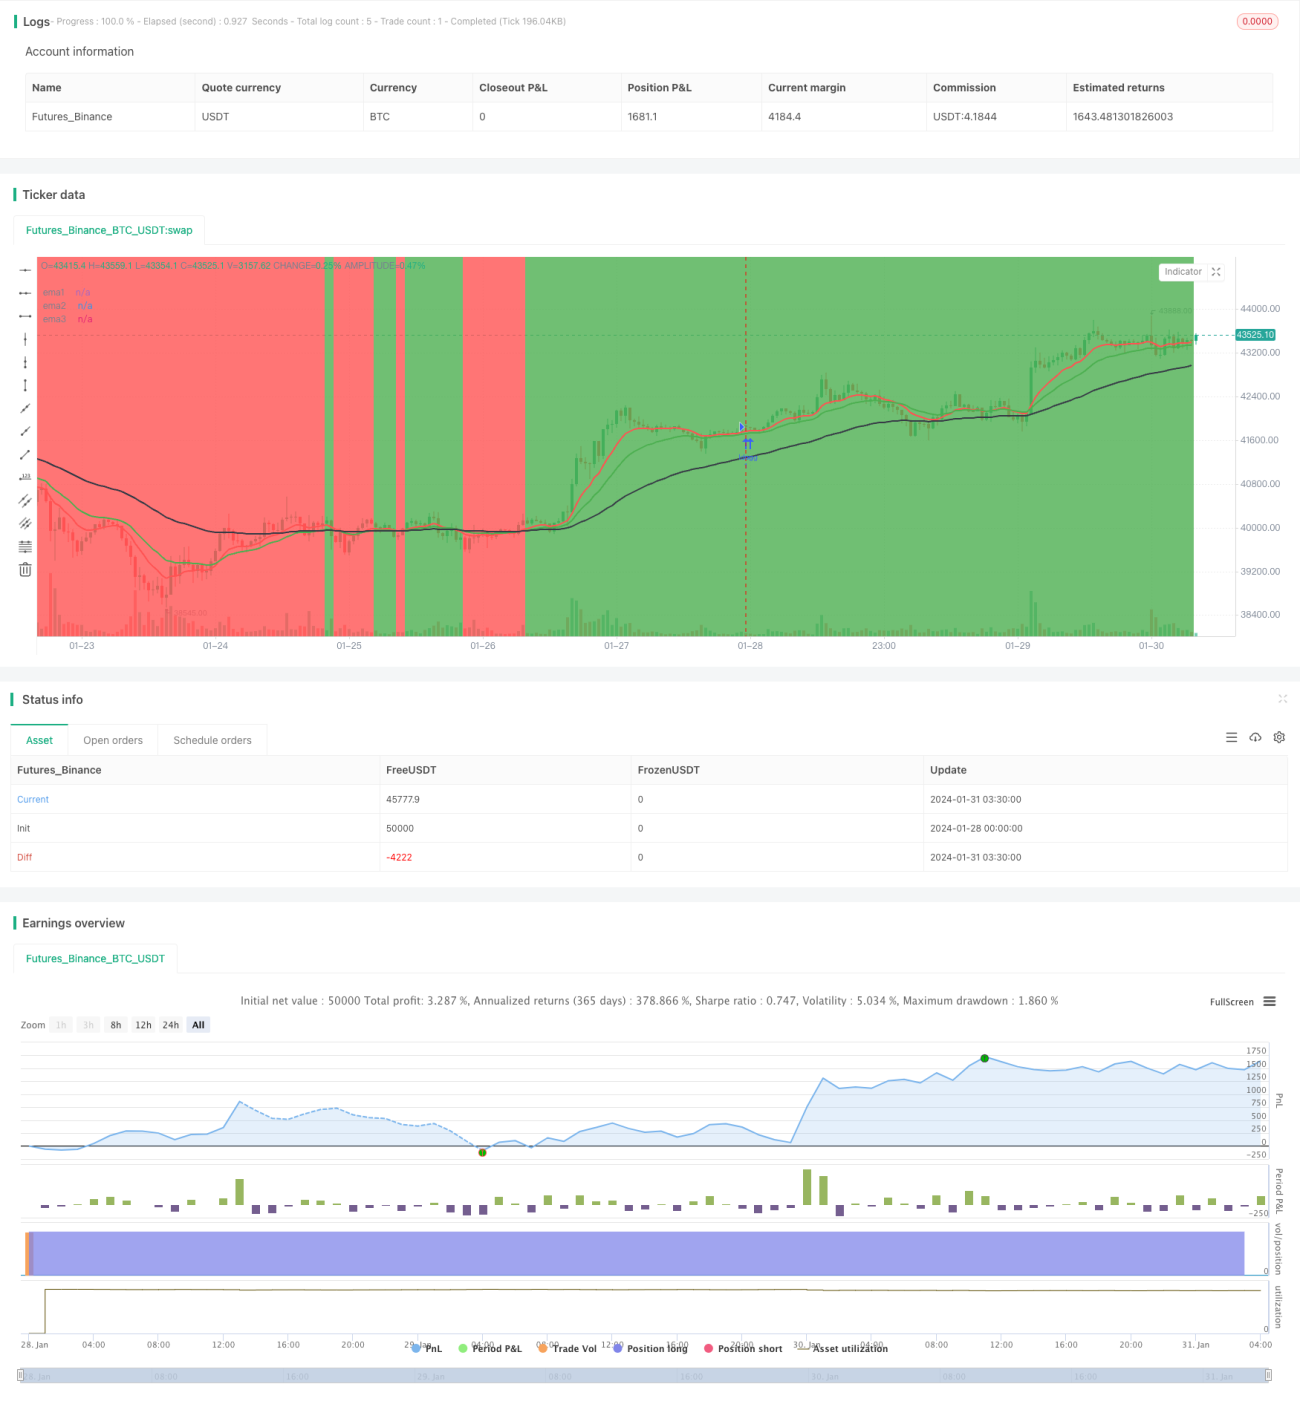
This strategy is based on 3 EMA lines of different periods. It judges the current trend direction by whether the price is above the EMA lines. When the short-term EMA line crosses above the long-term EMA line, a buy signal is generated. When the short-term EMA line crosses below the long-term EMA line, a sell signal is generated. This strategy tracks the trend runs and closes positions in time when trend reverses.
Strategy Logic
The strategy uses 3 EMA lines, which are 10-day, 20-day and 50-day respectively. The judging rules are:
-
When both 10-day EMA and 20-day EMA are above 50-day EMA, it is defined as an uptrend;
-
When both 10-day EMA and 20-day EMA are below 50-day EMA, it is defined as a downtrend;
-
When short-term EMA lines (10-day and 20-day) cross above long-term EMA line (50-day), a buy signal is generated;
-
When short-term EMA lines (10-day and 20-day) cross below long-term EMA line (50-day), a sell signal is generated;
-
Hold long position during uptrend and hold short position during downtrend;
-
Close current directional position when trend reverses (short-term EMA crosses long-term EMA).
The strategy captures profit by timely closing positions to lock in gains and alternating between long and short positions.
Advantage Analysis
The advantages of this strategy are:
- The rules are simple and clear, easy to understand and implement;
- Using EMA lines to determine trend avoids interference from short-term market fluctuations;
- Timely closing positions to track trend runs avoids expanding losses;
- No need to predict market direction with high winning rate by tracking trends.
Risk Analysis
There are also some risks in this strategy:
-
During range-bound markets, EMA lines may crossover frequently, resulting in high trading costs from frequently opening and closing positions;
-
Trend determination by EMA may fail after price gap, missing good entry opportunities.
To optimize the risks, some methods can be used:
-
Open position rules can be relaxed properly when EMAs are close to avoid over-trading;
-
Determine trend combining other indicators to avoid EMA failure.
Optimization Directions
The strategy can be optimized from the following aspects:
-
Parameter optimization. Test different EMA period combinations to find the optimal parameters;
-
Trading cost optimization. Optimize open position rules properly to reduce unnecessary frequent trading;
-
Stop loss strategy optimization. Set reasonable stop loss level to control single loss;
-
Combine other indicators. Use MACD, KDJ and other indicators to assist in determining optimal entry timing.
Summary
In general, this strategy is quite simple and practical. It uses EMA to determine trend direction with proper stop loss strategy to effectively control risks. There are also rooms for optimization. By combining parameter optimization, stop loss strategy and other indicators, the performance of this strategy can be further improved.
- 1