RSI and Bollinger Bands Fusion Trading Strategy for LTC

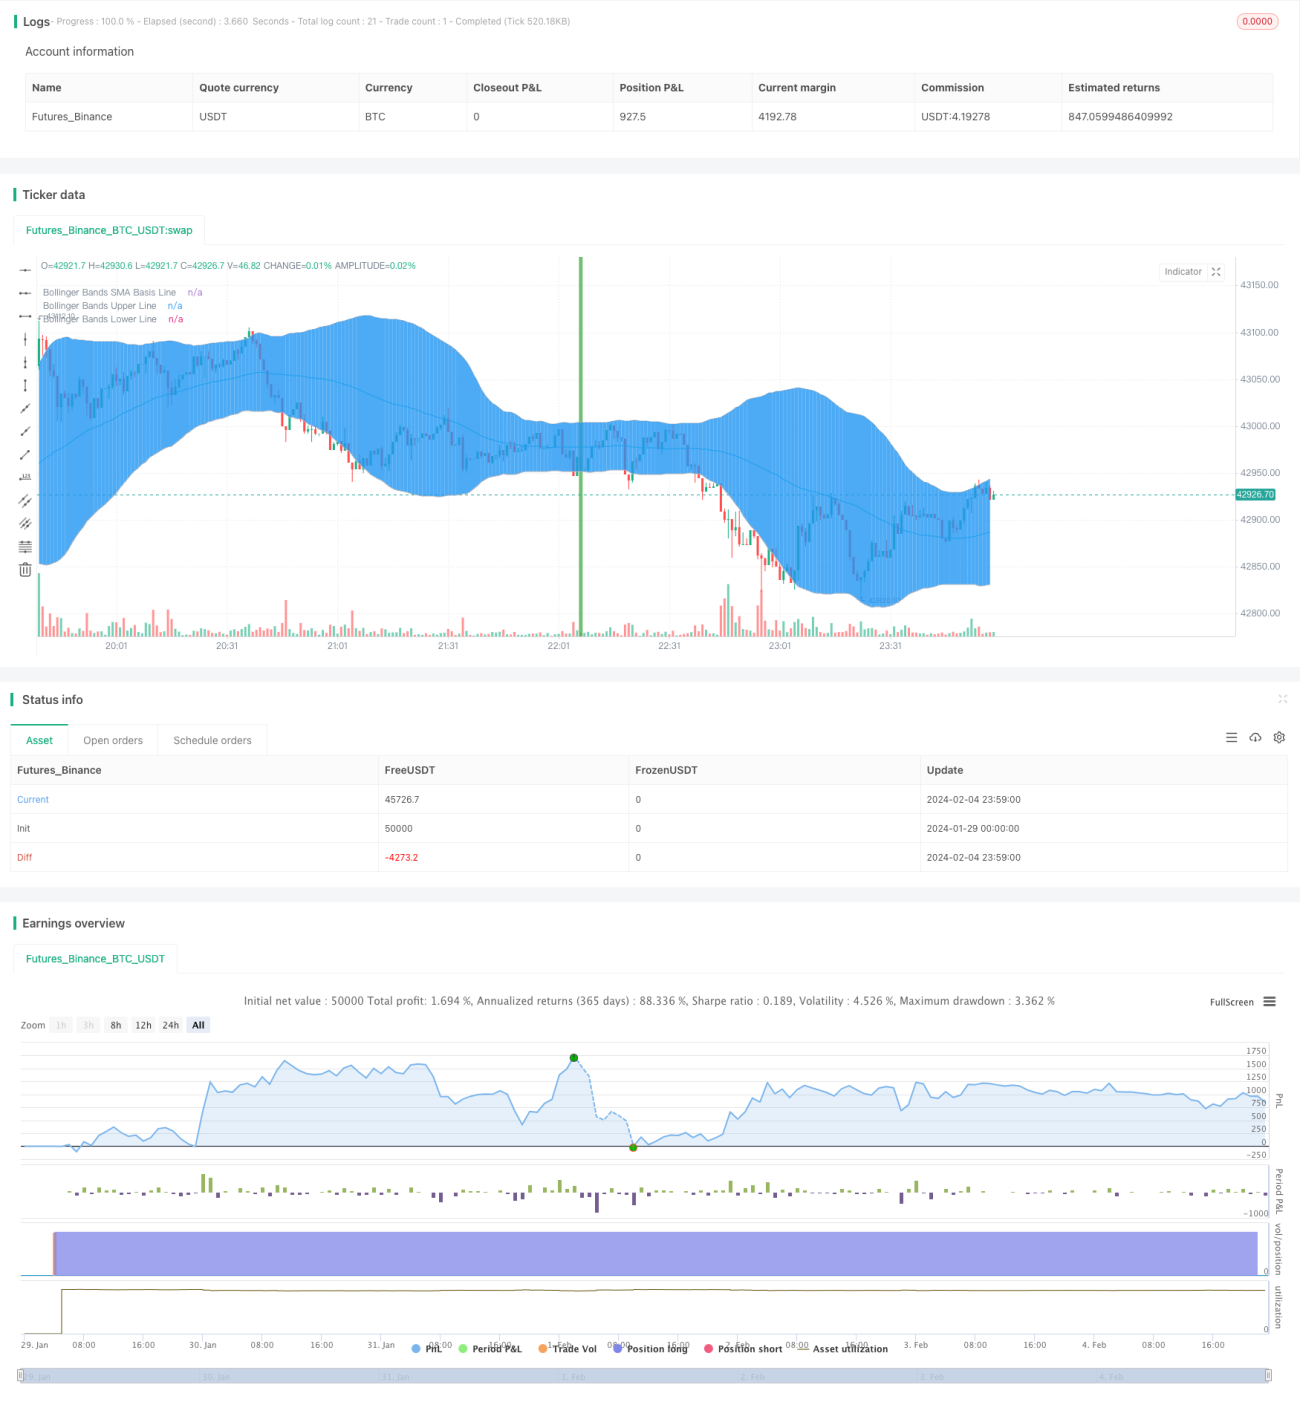
Overview
This strategy combines the Relative Strength Index (RSI) and Bollinger Bands to implement an automated strategy that can buy and sell Litecoin (LTC). It is suitable for the LTC/USD trading pair and runs in the Bitfinex cryptocurrency exchange.
Strategy Logic
The strategy mainly relies on the following two indicators for trading decisions:
-
Relative Strength Index (RSI): It reflects the magnitude and speed of price changes to determine if an asset is overbought or oversold. RSI below 20 is seen as oversold while above 80 is seen as overbought.
-
Bollinger Bands: It contains three lines - middle line, upper band and lower band. The middle line is the n-day moving average. The upper and lower bands are middle line ± 2 standard deviation of prices over last n days. Price near upper band suggests overbought condition and near lower band suggests oversold condition.
According to these two indicators, the trading rules are:
Buy Signal: When RSI crosses above 20 from low zone, it indicates an oversold condition that may reverse. If price also breaks below lower band of Bollinger Bands, a buy signal is triggered.
Sell Signal: When RSI crosses below 80 from high zone, it indicates an overbought condition that may reverse. If price also breaks above upper band of Bollinger Bands, a sell signal is triggered.
As we can see, the strategy considers both market overbought/oversold condition and price breakout to generate trading signals.
Advantages
The main advantages of this strategy are:
-
Combines RSI and Bollinger Bands to comprehensively judge market condition, resulting in reliable signals.
-
RSI gauges overbought/oversold levels while Bollinger Bands depict price deviation from typical distribution. The two complements each other.
-
Considers both indicator readings and price breakout to avoid false signals during range-bound market.
-
Reasonable parameter settings of RSI and Bollinger Bands period and thresholds based on optimization to prevent indicator failure.
-
Specifically optimized for LTC. Performance is good based on historical data backtest. Further optimization can improve it more.
Risks
Despite the advantages, some risks exist:
-
Both RSI and Bollinger Bands may fail, especially during abnormal market condition, leading to wrong signals and losses.
-
Parameter optimization relies on historical data. Significant market regime change can make these parameters invalid, deteriorating strategy performance.
-
Although two indicators are used, whipsaws may still occur during range-bound market, causing losses and opportunity cost.
-
Trading cost is ignored in the strategy. High trading frequency and oversized position can erode profits quickly via costs.
To reduce the above risks, methods like parameter tuning, more indicators, position sizing, limiting trading frequency etc. can be adopted.
Improvement Directions
Some directions to improve the strategy:
-
Test different RSI and Bollinger Bands parameters for better settings.
-
Introduce position sizing rules based on account equity.
-
Set stop loss, or use other indicators to determine stop loss and take profit levels to limit max drawdown.
-
Consider slippage to adjust parameters and stop loss in live trading.
-
Add more factors like volatility index, volume etc to form a multifactor model for higher accuracy.
-
Design adaptive mechanisms according to different LTC market regimes and cycles to dynamically adjust strategy parameters.
Conclusion
This strategy judges overbought/oversold levels first and then combines with breakout to generate trading signals, making it suitable for LTC. But risks like indicator failure, regime change and trading costs should be watched out. There are many directions for improvement and further optimization can lead to better results.
- 1