V-Reversal SMA Strategy

Overview
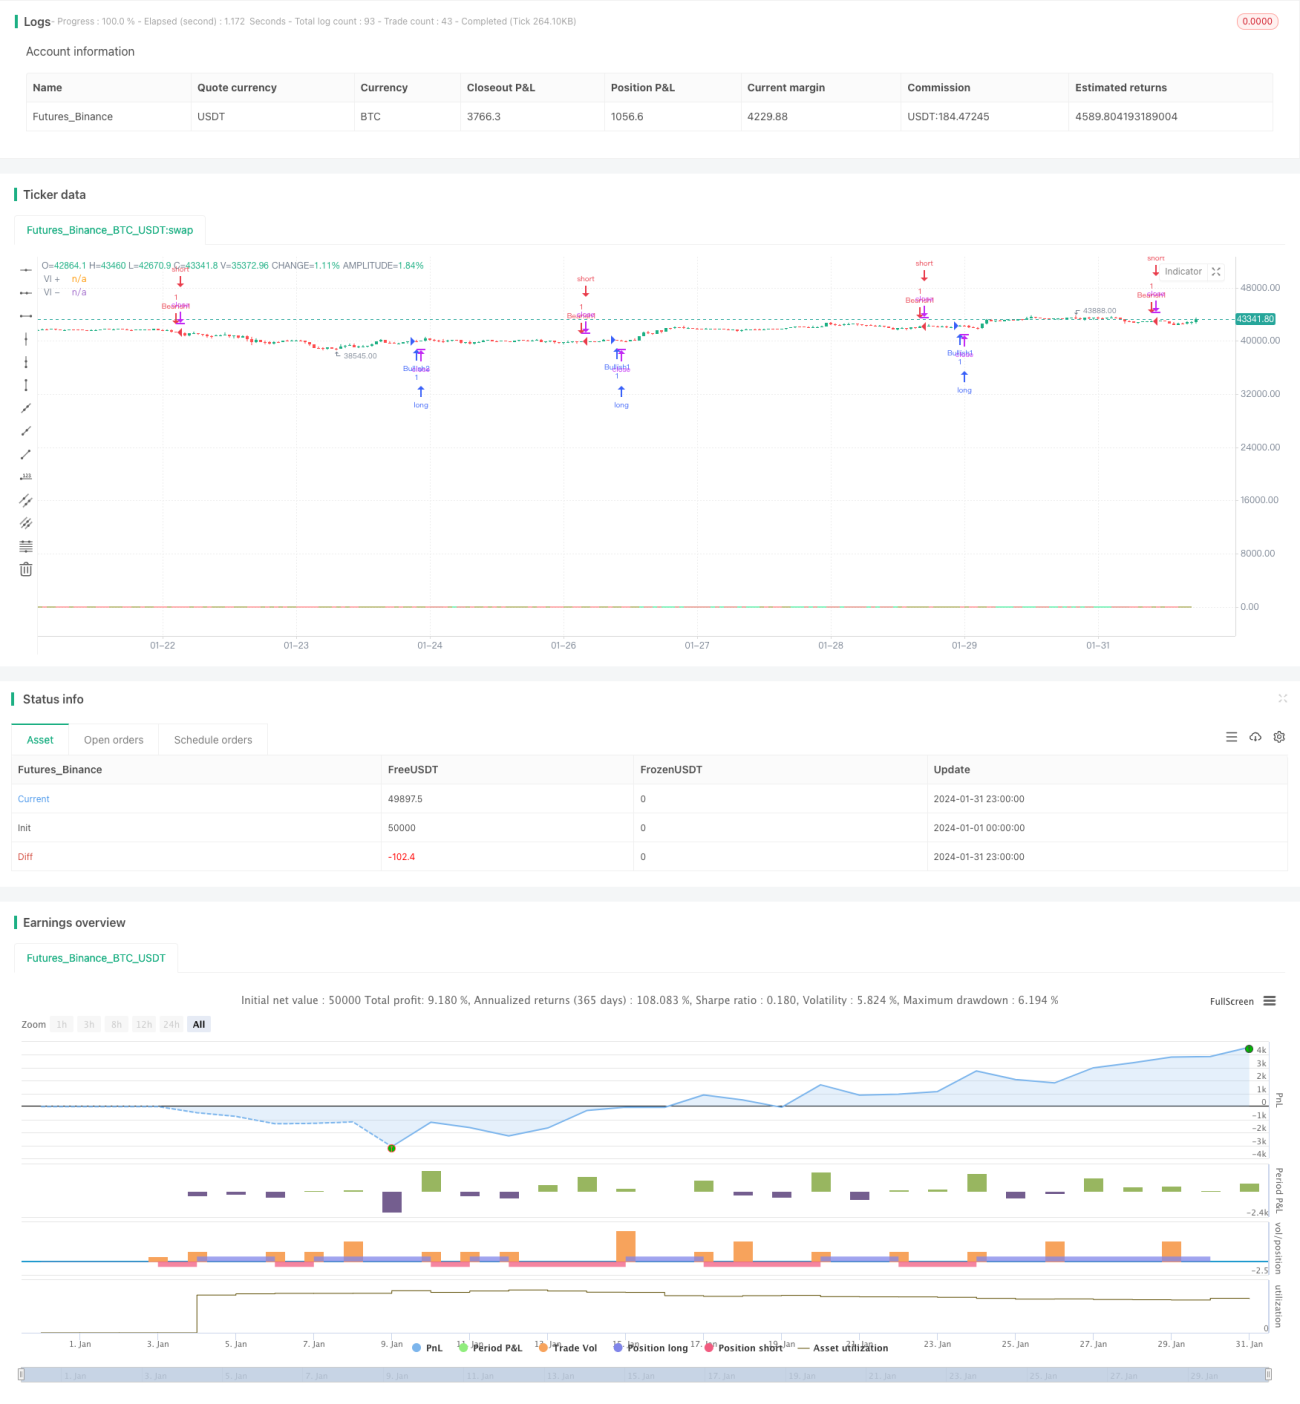
The V-Reversal SMA strategy calculates the 14-day absolute difference between the highest price and the previous day's lowest price, and the 14-day absolute difference between the lowest price and the previous day's highest price. Then it calculates their 14-day simple moving averages to form the VI+ and VI- curves. A buy signal is generated when VI+ crosses over VI-. A sell signal is generated when VI- crosses below VI+.
Principle
The core indicators of this strategy are VI+ and VI-. VI+ reflects bullish momentum while VI- reflects bearish momentum. The specific calculation formulas are as follows:
VMP = SUM(ABS(HIGH - LOW[1]),14)
VMM = SUM(ABS(LOW - HIGH[1]),14)
STR = SUM(ATR(1),14)
VI+ = VMP/STR
VI- = VMM/STR
To remove oscillations in the curves, 14-day simple moving averages are calculated on VI+ and VI- to obtain SMA(VI+) and SMA(VI-). A bullish signal is generated when SMA(VI+) crosses over SMA(VI-). A bearish signal is generated when SMA(VI-) crosses below SMA(VI+).
In addition, the strategy also combines the upward and downward status of VI+ and VI- to judge the trend and filter out signals, going long only when the trend is down and going short only when the trend is up.
Advantage Analysis
By combining trend status and golden/dead cross of the VI indicator, this strategy can effectively filter out false signals and improve profitability. Compared to simple moving average strategies, its breakout signals are more reliable.
Risk Analysis
The main risks of this strategy are:
-
The VI indicator may generate misleading signals in certain periods. Trend filtering and stop loss should be used to control risks.
-
Markets with high trading costs and slippage are not suitable for this strategy as it would greatly reduce profit margin.
Optimization Directions
The strategy can be optimized in the following aspects:
-
Optimize the parameters of the VI indicator to find the best parameter combination.
-
Use machine learning methods to automatically identify misleading signals and improve signal quality.
-
Optimize exit mechanisms with stop loss and money management to control single trade loss.
-
Optimize trading products selection focusing on markets with lower trading costs.
Conclusion
The V-Reversal SMA strategy determines trading signals by calculating the VI+ and VI- indicators and combining trend status. It is a relatively reliable trend following strategy. Its strength lies in high signal quality and ability to filter out noise. But it also faces risks of being trapped, requiring continuous optimizations to adapt to market changes.
- 1