Bollinger Band Mean Reversion Strategy with Intraday Intensity Index

Overview
This strategy is a mean reversion strategy based on Bollinger Bands and Intraday Intensity Index. It utilizes the price breakouts of Bollinger Bands upper and lower band, combined with the volume indicator Intraday Intensity Index to determine the entry timing. The advantages of this strategy include: gaining profits from the mean reversion of prices, and filtering signals with volume indicators. However, it also has risks like large drawdowns and long profit time.
Strategy Principle
The strategy first calculates the middle band, upper band and lower band of Bollinger Bands. The middle band is the simple moving average or exponential moving average of the closing price. The upper and lower bands are constructed by adding/subtracting two standard deviations on the middle band. When price breaks through the lower band, it is considered an opportunity for mean reversion, taking long position. When price breaks through upper band, it is considered over-deviation from mean, taking short position.
As an assisted indicator for judgement, the strategy introduces Intraday Intensity Index. This indicator combines both price and volume information. When the index is positive, it indicates the buying power is strengthening, giving long signal. When the index is negative, it indicates selling power is strengthening, giving short signal.
For opening positions, the strategy requires both price breakout of Bollinger Bands band and the Intraday Intensity Index indicator judgement. For stop loss, the strategy adopts time based stop loss. If no profits after certain periods, the strategy chooses to cut loss and exit.
Advantage Analysis
The biggest advantage of this strategy is utilizing the mean reversion of prices to profit. When prices have large deviations from mean, according to statistical laws, the probability prices revert back to mean is relatively large. This provides the theoretical basis for the strategy's operations.
Another advantage is the introduction of volume indicator - Intraday Intensity Index, to filter price signals. Trading volumes can prove the validity of price signals. This avoids the wrong signals generated in some violent price fluctuations with low volumes.
Risk Analysis
Although this strategy relies on the probability event of price mean reversions, the random walk of market prices can still trigger stop loss, leading to losses. This is a common risk faced by mean reversion strategies.
Another major risk is that the process of prices reverting to mean itself is a relatively long cycle. For investors, capital may be held for some period of time. Such time risk may cause investors to miss other better investment opportunities.
Optimization Directions
The strategy can be optimized in the following aspects:
-
Optimize Bollinger Bands parameters, adjust cycle and deviation metrics to adapt to volatility of different markets
-
Try other types of moving averages, like weighted moving average to increase smoothness
-
Try other types of volume indicators, searching for better volume-price confirmation signals
-
Add stop loss/profit taking strategies, control max loss per order
Conclusion
In conclusion, this strategy is a typical mean reversion strategy. It profits on probability events, but the risks are obvious as well. Better results may be obtained through adjustments of parameters and optimizations of indicators. But for investors, recognizing the attributes correctly of this strategy is also the key.
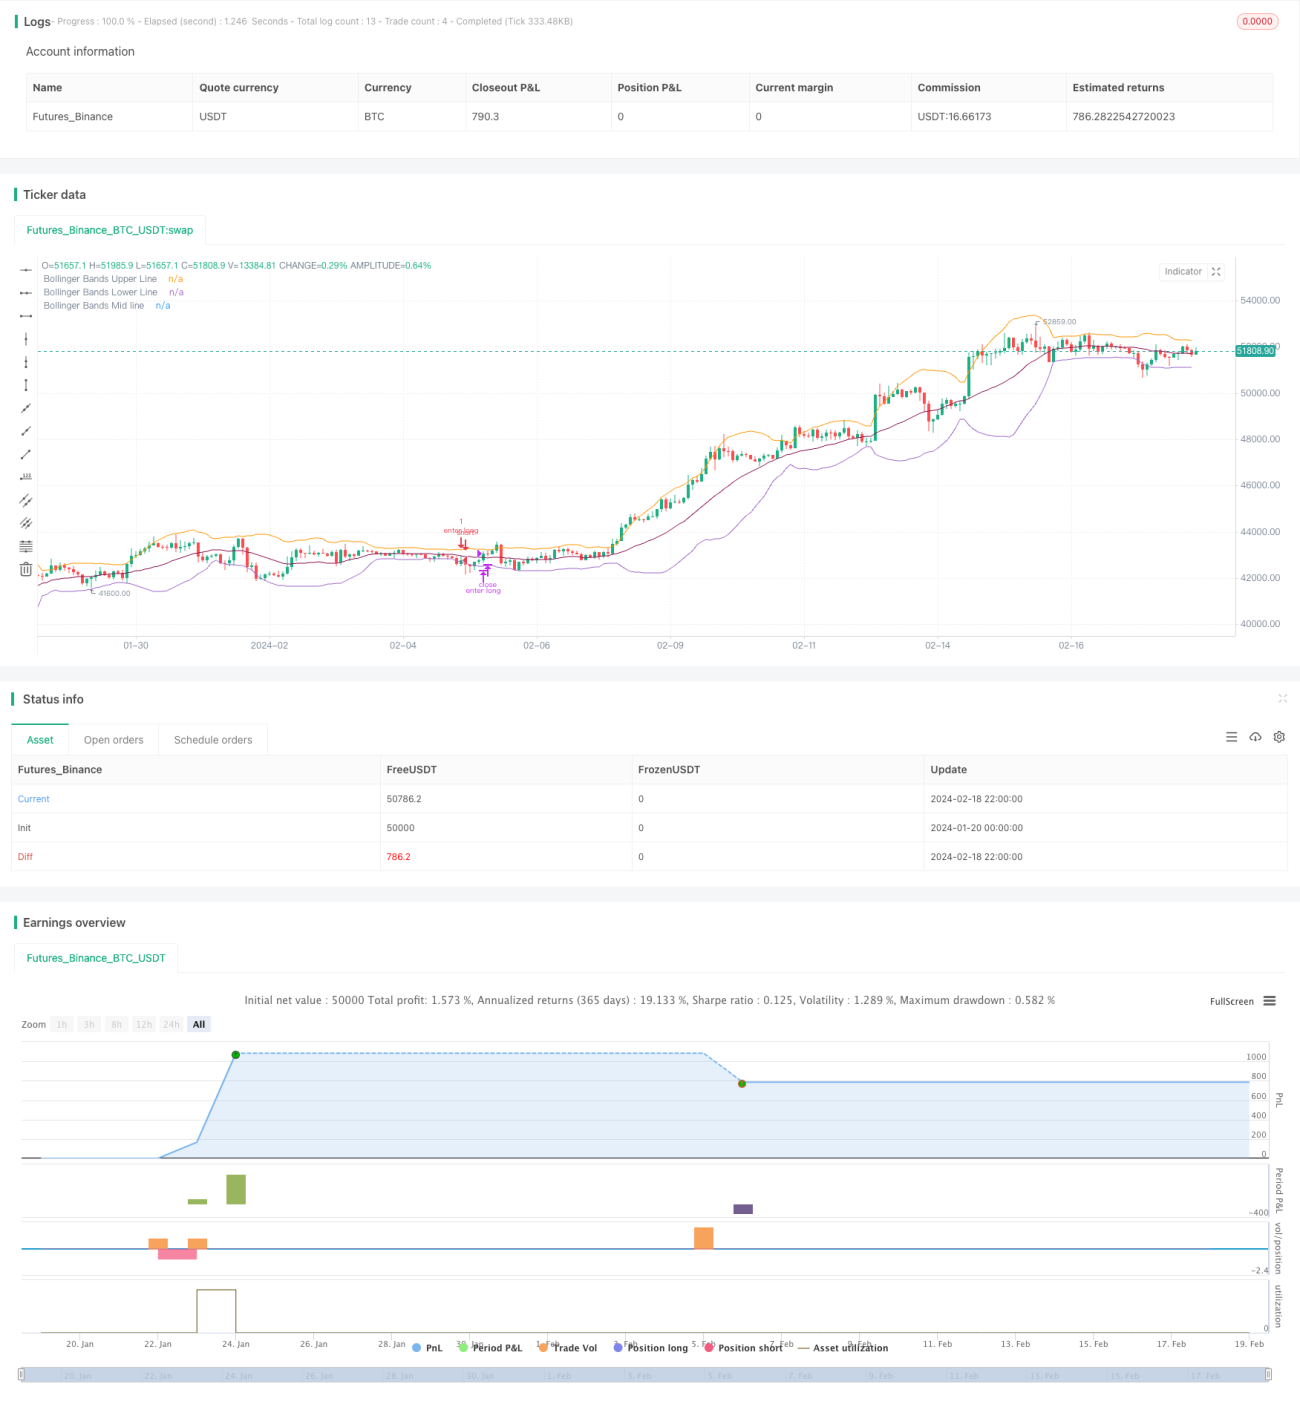
/*backtest
start: 2024-01-20 00:00:00
end: 2024-02-19 00:00:00
period: 2h
basePeriod: 15m
exchanges: [{"eid":"Futures_Binance","currency":"BTC_USDT"}]
*/

//@version=4
// This source code is subject to the terms of the Mozilla Public License 2.0 at https://mozilla.org/MPL/2.0/

// Bollinger Bands Strategy with Intraday Intensity Index- 1