Momentum Breakout Backtesting Support Resistance Strategy

Overview
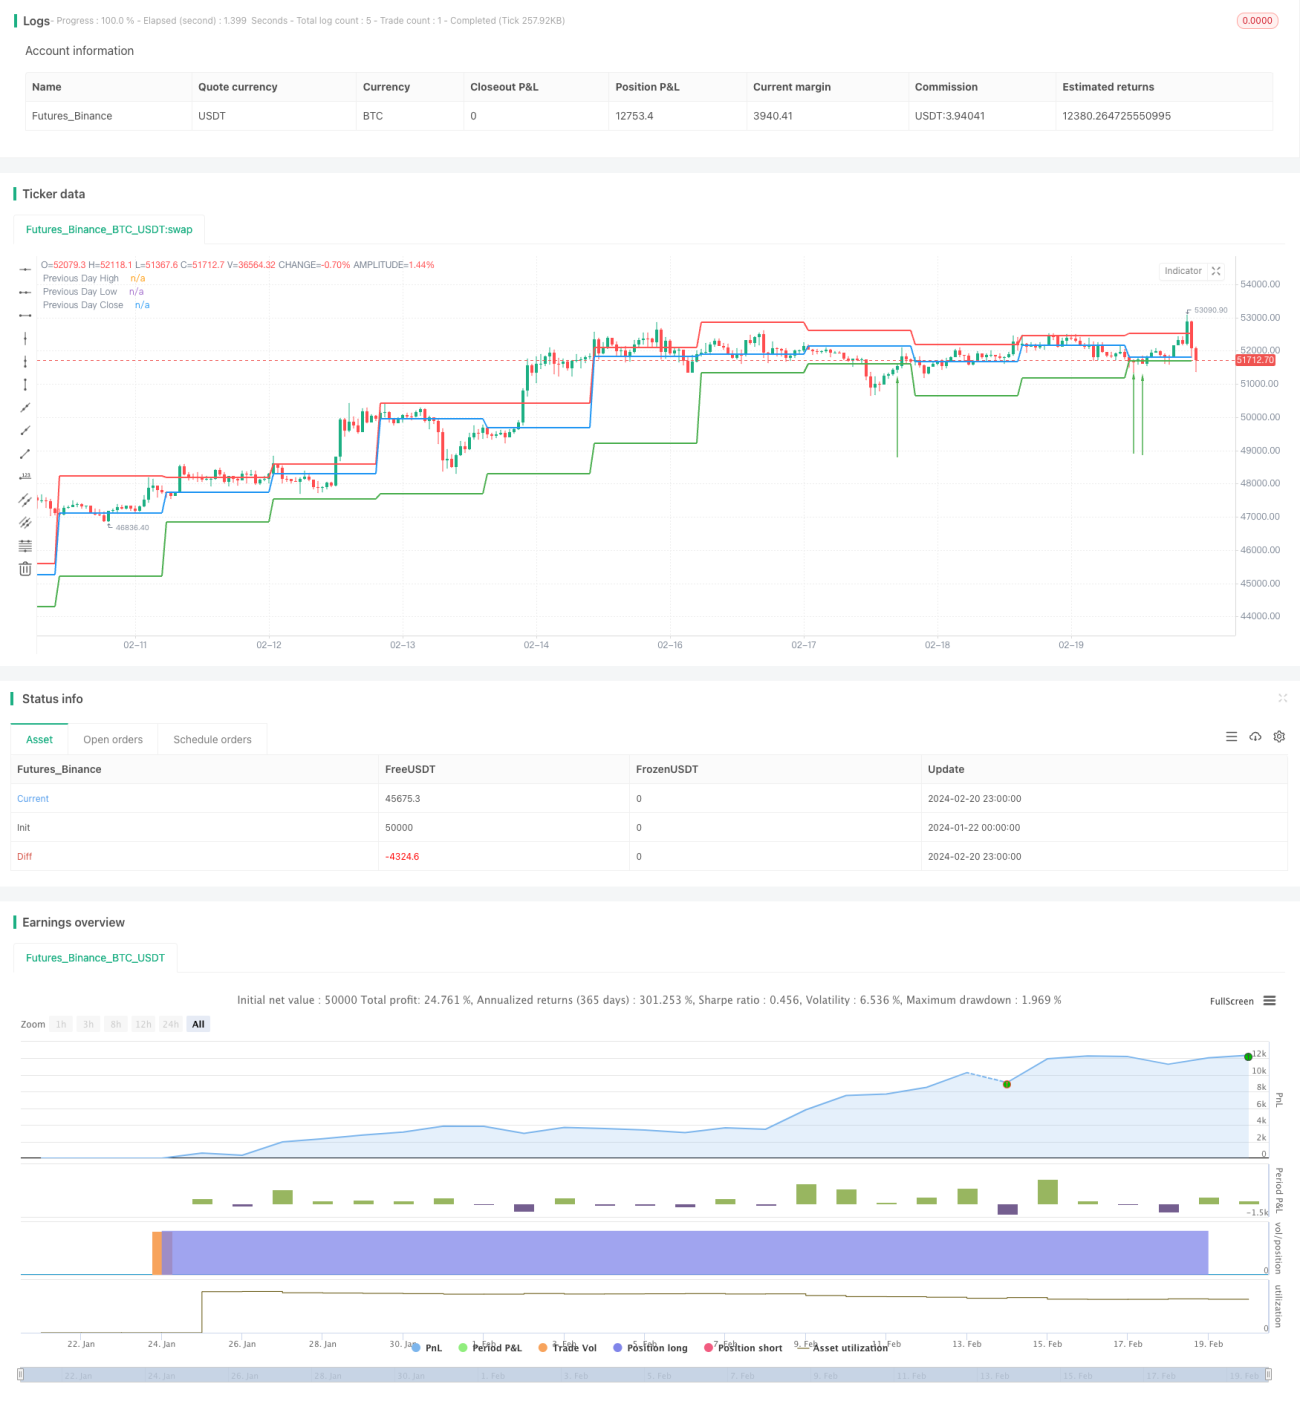
This strategy mainly uses the previous trading day's high, low and close prices as the support and resistance levels for the current day. It goes long when the resistance level is broken and goes short when the support level is backtested. It belongs to a typical breakout strategy.
Strategy Principle
The code first defines a function calculateSupportResistance to calculate the support and resistance levels, which extracts the previous trading day's high, low and close prices as the current day's support and resistance levels.
Then in the main logic, this function is called to get these three price levels and plot them.
In the backtesting logic, if the close price is lower than the previous day's low while the current price is higher than that low forming a breakout, it goes long. If the close price is higher than the previous day's high while the current price is lower than that high forming a breakout, it goes short.
Through this breakout model, the judgment of trend and generation of trading signals are implemented.
Advantages
-
Use previous trading day's data to build current day's support and resistance levels, avoiding the parameter optimization problem
-
Support and resistance levels come from real market trading data, with some reference value
-
Simple and straightforward backtesting model, easy to understand and implement
-
Visual display of support and resistance levels forms perception of prices
-
Real-time monitoring of breakouts, timely catching trading opportunities
Risks
-
Support and resistance levels change over time, hard to determine validity
-
Unable to predict trend direction, risk of missing reversals
-
Easily affected by false breakouts, premature entry risk
-
Unable to determine persistence of breakouts, early stop loss likely
-
Individual support and resistance failure more likely under huge market fluctuation
Countermeasures:
-
Combine more factors to judge validity of breakouts
-
Appropriately expand stop loss range to catch trends
-
Open positions in batches, reduce impact of individual fluctuations
Optimizations
-
Add more historical data like 5-day, 10-day lines to determine levels
-
Incorporate other indicators like volume to judge breakout validity
-
Set stop loss based on actual volatility
-
Optimize capital management, control single loss
Summary
Overall this is a typical breakout strategy, simple and intuitive. By building current day's support and resistance with previous day's data and backtesting breakouts of those levels for long/short. Pros are easy to understand and directly visualize levels; cons are false breakout risks and uncertainty of persistence. Next steps are improving breakout validity, controlling risks, optimizing capital management etc.
- 1