Moving Average Indicator Strategy

Overview
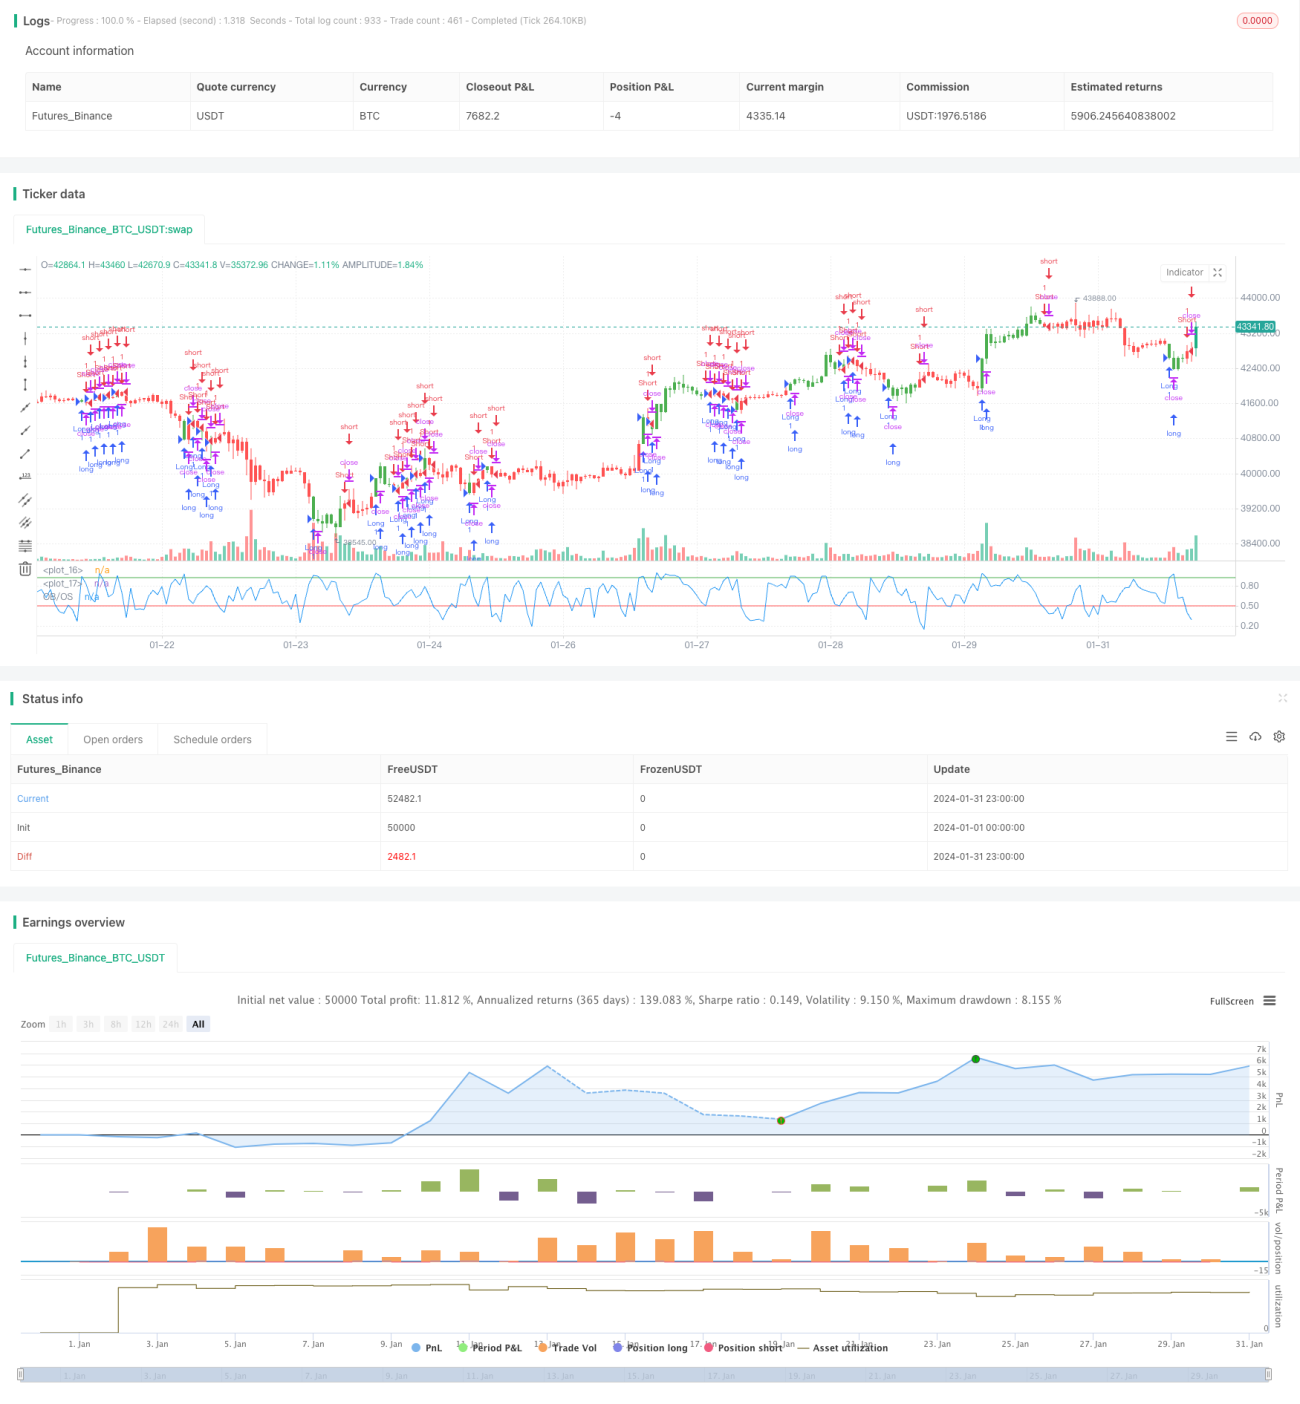
The Moving Average Indicator strategy is a quantitative trading strategy that judges market trends based on moving averages and conducts long or short position operations. By calculating the average closing price over a period of time, this strategy determines whether the market is overbought or oversold in order to capture price reversal opportunities.
Strategy Principle
The core indicator of this strategy is the Stochastic Oscillator. Its calculation method is:
Low = the lowest low of the most recent N days
High = the highest high of the most recent N days
K value = (Current close – Low)/(High – Low)*100
Where N is the length Length. This indicator roughly reflects the position of the current closing price relative to the price range over the most recent N days.
When the K value is greater than the overbought line (BuyBand), it indicates that the stock may be overbought and a callback will occur. When the K value is less than the oversold line (SellBand), it indicates that the stock may be oversold and a rebound will occur.
According to this judgment rule, the strategy will sell to open a position in the overbought zone and buy to open a position in the oversold zone. The closing condition is that the indicator line re-enters the intermediate zone ((SellBand, BuyBand)).
Advantage Analysis
This strategy has the following advantages:
- Using moving average indicators to determine market trends, good backtesting results, easy to form trading signals
- Flexible to adapt to different cycles and varieties by adjusting parameters
- The strategy idea is simple and clear, easy to understand and optimize
Risk Analysis
The strategy also poses some risks:
- Moving averages are prone to false touches, possibly being "whipsawed”
- Improper parameter settings can lead to frequent trading or unclear signals
- Only one indicator is considered, limited optimization space
These risks can be reduced by appropriately optimizing indicator parameters or adding filter conditions.
Optimization Directions
The main aspects that this strategy can be optimized include:
- Add volume or ATR and other indicators to ensure more reliable trading signals
- Add Stoch indicators of multiple cycles, generate signals through composite operations
- Increase additional judgment indicators such as MACD and KDJ to achieve multi-indicator aggregation
- Traverse and optimize trading varieties, cycles, parameters to find the optimal configuration
Conclusion
The overall idea of the Moving Average Indicator strategy is simple and widely used with relatively stable backtesting results, making it suitable as a beginner’s quantitative trading strategy. However, this strategy has limited optimization space as it considers limited factors and is only suitable for short-term operations. Future upgrades can be made through multi-indicator aggregation, machine learning, etc.
/*backtest
start: 2024-01-01 00:00:00
end: 2024-01-31 23:59:59
period: 1h
basePeriod: 15m
exchanges: [{"eid":"Futures_Binance","currency":"BTC_USDT"}]
*/

//@version=2
////////////////////////////////////////////////////////////
//  Copyright by HPotter v1.0 25/09/2017
// Simple Overbought/Oversold indicator- 1