Ichimoku Cloud Trend Following Strategy

Overview
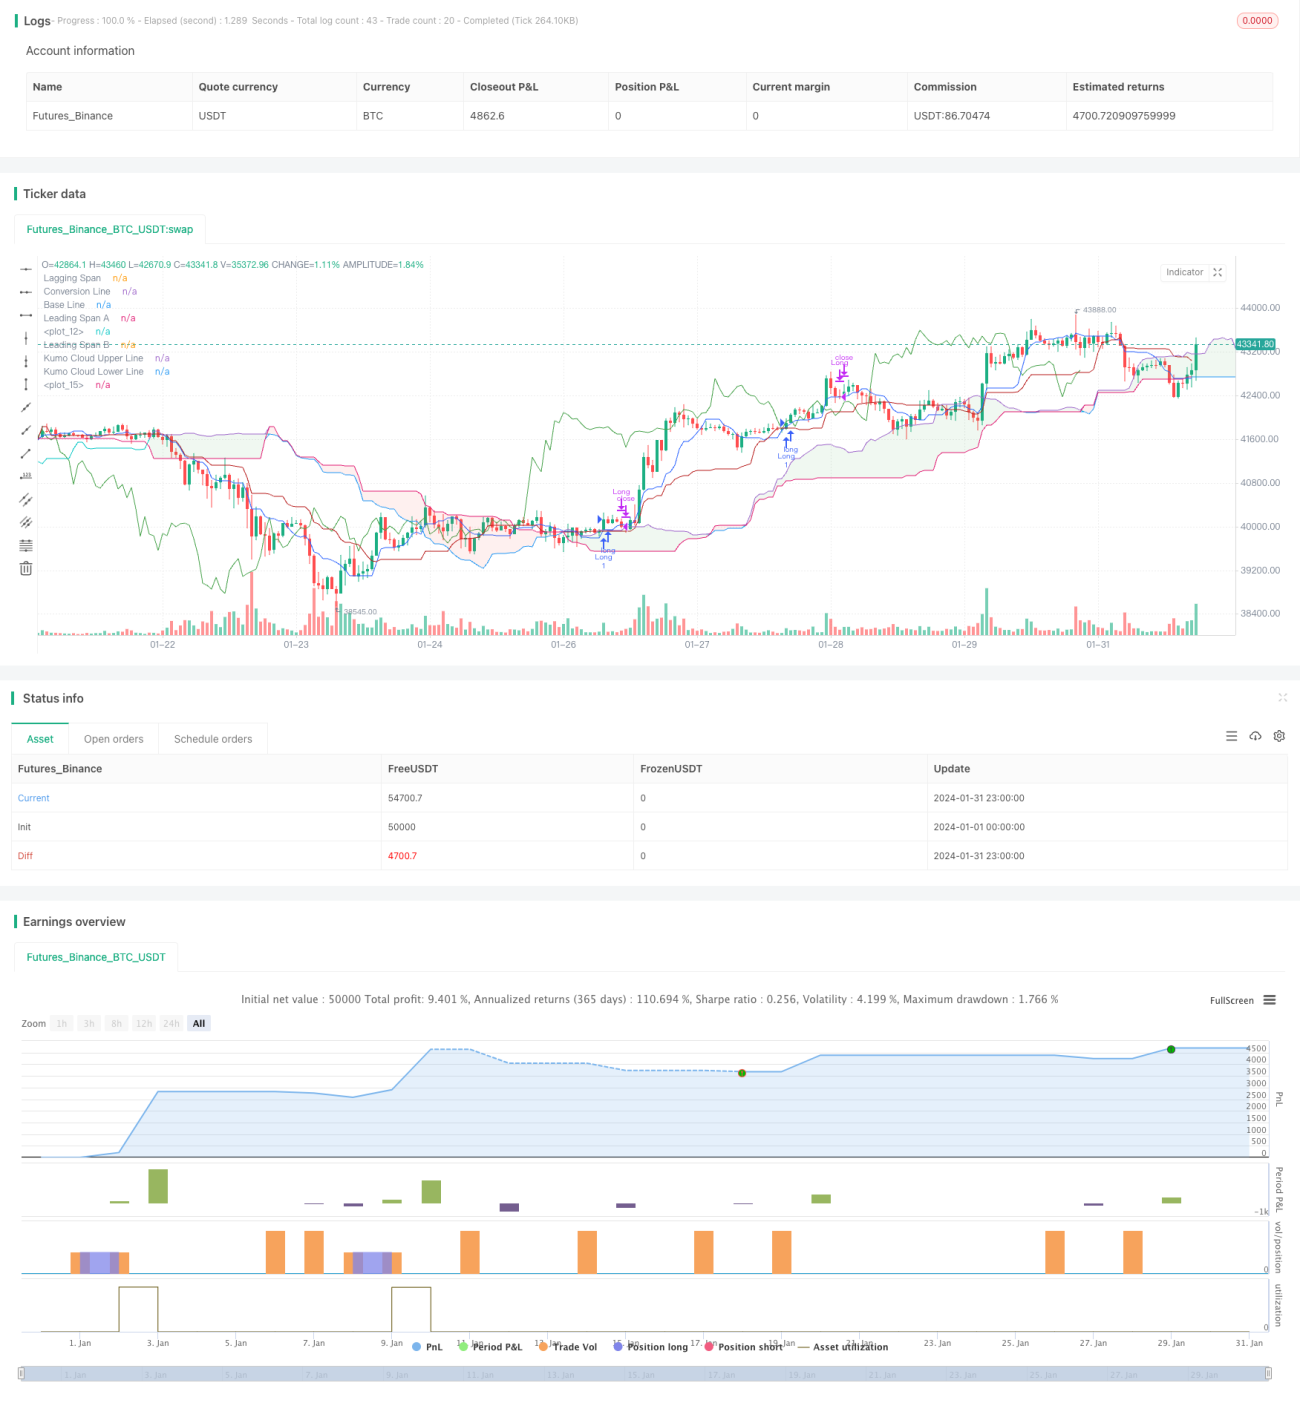
The Ichimoku Cloud trend following strategy is a technical analysis strategy. It uses the five indicator lines of the Ichimoku Cloud to determine market trend direction, support/resistance levels, and entry timing.
Principle
The core indicator lines include:
- Conversion Line: The 9-day average of highest high and lowest low, reflecting short-term trend.
- Base Line: The 26-day average of highest high and lowest low, reflecting medium to long term trend.
- Leading Span A: The average between the conversion and base lines, shifted forward 26 days, judging medium-term support and resistance.
- Leading Span B: The 52-day average of highest high and lowest low, shifted forward 26 days, judging long-term support and resistance.
- Lagging Span: The price shifted backward 26 days, reflecting trend momentum.
Buy signal triggered when conversion line crosses above base line. Sell signal triggered when crossing below base line. Lagging span above price and green cloud color indicates bull trend.
It judges trend direction based on the relationship between conversion and base line. For example, when conversion line breaks out base line upwards, it signals a bull trend. If lagging span is also above price, long entry triggered.
Set stop loss or take profit based on Leading Span A or Base Line. If Base Line is chosen for stop loss, close position when price breaks below Base Line.
Advantage Analysis
The advantages include:
- Utilize multiple indicators for higher accuracy.
- Leading Span anticipates support/resistance levels.
- Lagging Span verifies momentum to avoid false breakouts.
- Base Line as medium/long term indicator reduces noise.
Risks and Improvements
Main risk is false signals. Suggested optimizations:
- Adjust average periods to fine tune sensitivity.
- Add other filters like MACD, Bollinger Bands.
- Lower trading frequency to follow mid/long term trend.
Conclusion
Ichimoku Cloud combines indicators to judge market trend. It considers both short-term momentum and mid/long term trend. Conversion and Base Lines determine trading signals. Base Line sets stop loss to lock in profits and control risks. This strategy suits mid/long term trend following.
/*backtest
start: 2024-01-01 00:00:00
end: 2024-01-31 23:59:59
period: 1h
basePeriod: 15m
exchanges: [{"eid":"Futures_Binance","currency":"BTC_USDT"}]
*/

//@version=5
strategy(title="Ichimoku Cloud - BitBell", shorttitle="Ichimoku Cloud - BitBell", overlay=true)
conversionPeriods = input.int(9, minval=1, title="Conversion Line Length")
basePeriods = input.int(26, minval=1, title="Base Line Length")- 1