Walnut Trend Following Strategy Based on Distance from 200 EMA

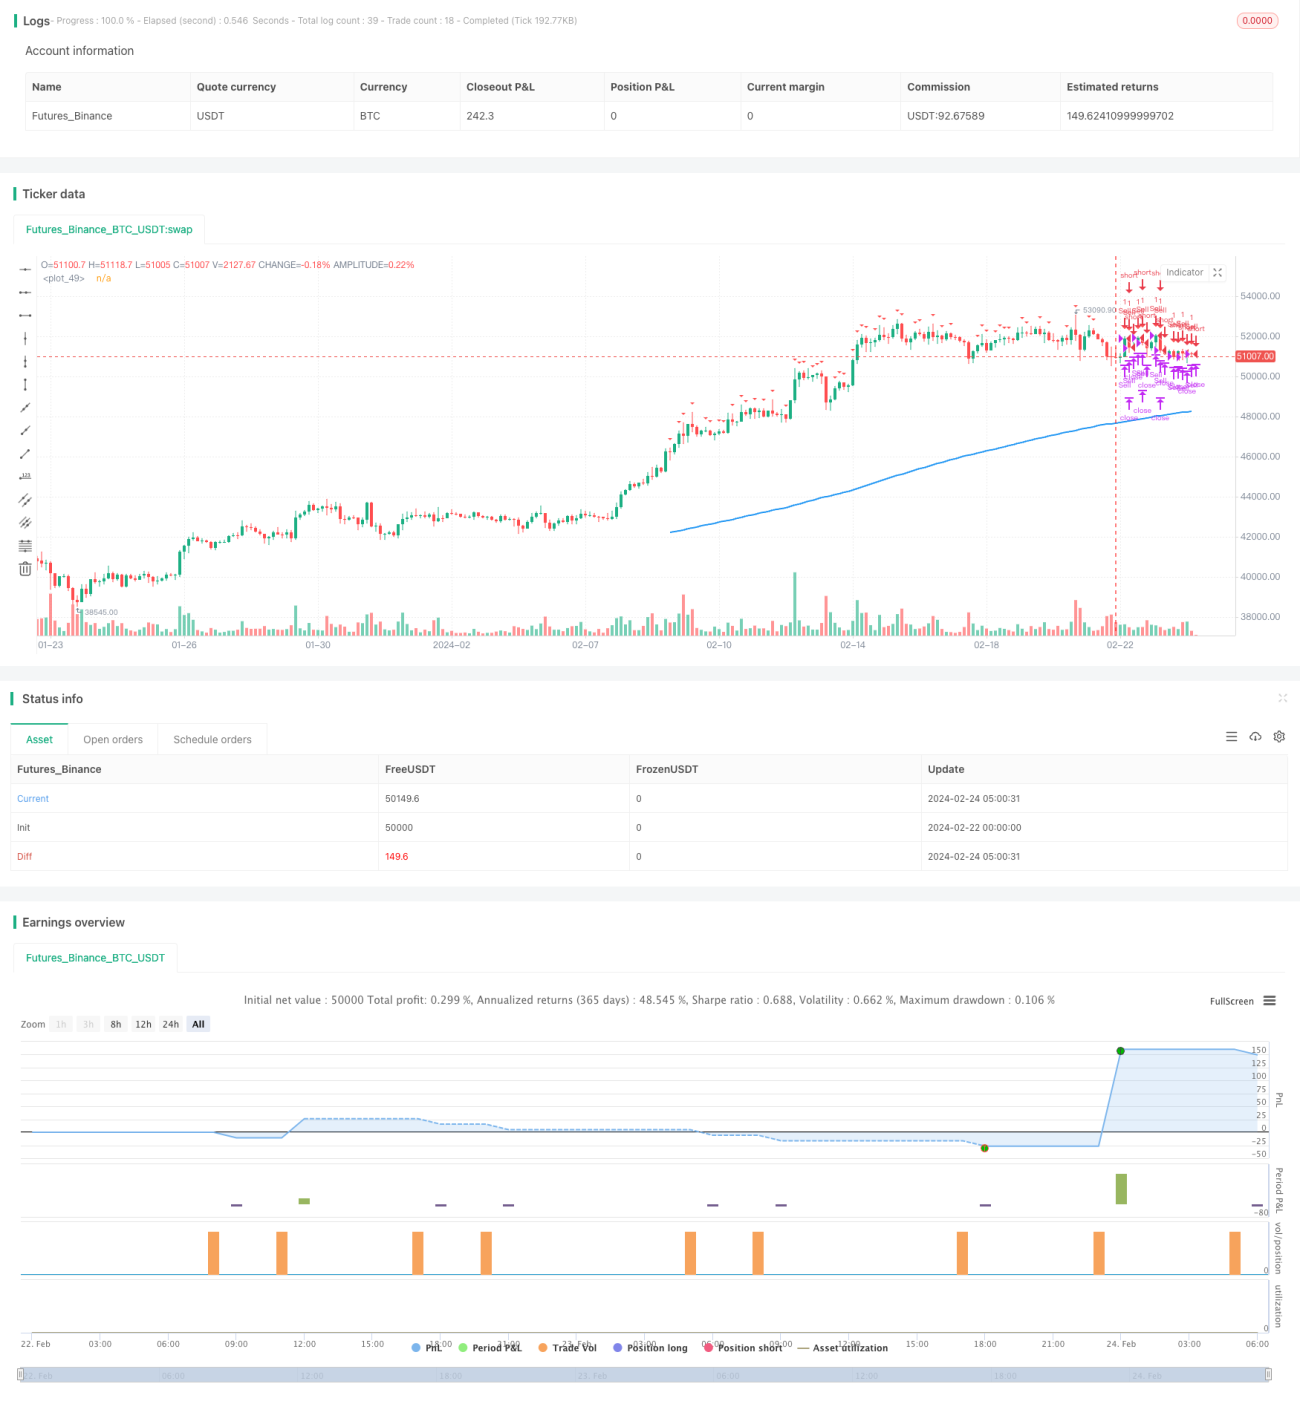
This article will analyze in detail a trend following strategy based on the distance between price and 200-day moving average, called “Walnut Trend Following Strategy Based on Distance from 200 EMA”. This strategy establishes positions when the price exceeds a preset threshold from the 200-day moving average and closes positions when reaching the profit target.
I. Strategy Logic
The core indicator of this strategy is the 200-day exponential moving average (200 EMA). The strategy judges if the price deviates from the 200-day line by a set percentage threshold. Long positions are established when the last candlestick is a green candle and short positions are established when the last candlestick is a red candle. The long entry conditions are price below 200 EMA and price percentage deviation above threshold. The short entry conditions are price above 200 EMA and price percentage deviation above threshold.
The exit conditions are when price reverts to 200 EMA or reaches 1.5 times the entry price as profit target. The stop loss is set at 20% of the option premium.
The detailed entry and exit conditions are:
Long Entry: Close < 200 EMA && Percentage Distance ≥ Threshold && Last Candle Green
Short Entry: Close > 200 EMA && Percentage Distance ≥ Threshold && Last Candle Red
Long Exit: Close ≥ 200 EMA || Reaches Profit Target || End of Day
Short Exit: Close <= 200 EMA || Reaches Profit Target || End of Day
The stop loss is 20% of the option premium.
II. Advantages
The main advantages of this strategy are:
- Using 200-day moving average to determine medium-long term trend, avoiding short-term market noise
- Establishing trend following mechanism to track medium-long term price trend
- Optimizing entry timing when last candle direction aligns with major trend
- Reasonable stop loss and take profit to avoid larger losses
III. Risks
The main risks of this strategy are:
- Multiple losses may occur during market consolidation around moving average
- Sudden trend reversal triggers stop loss
- Inappropriate parameter selection like moving average period leads to inaccurate trend judgment
The following aspects can be optimized to reduce the above risks:
- Adjust moving average parameters or add other indicators to determine major trend
- Optimize stop loss mechanism like adjusting stop distance based on price change
- Optimize entry conditions with more judgment indicators
IV. Optimization Directions
The main optimization directions for this strategy are:
- Optimize moving average parameters, test impacts of different period parameters
- Add other indicators like Bollinger Bands, KDJ to determine major trend
- Adjust stop loss strategy to trail price dynamically
- Optimize entry conditions to avoid wrong entries due to short-term corrections
V. Conclusion
This article analyzed in detail the logic, strengths, weaknesses and optimization directions of the trend following strategy based on the distance between price and 200-day moving average. This strategy judges medium-long term trend by tracking the price deviation from long-term moving average. Positions are established when the deviation exceeds a threshold and closed when hitting stop loss or take profit targets. This strategy can track medium-long term trend well but still has some parameter optimization space. Future improvements can be made from multiple perspectives to make the strategy more robust across different market conditions.
- 1