MACD+EMA Multi-Timeframe Breakout Strategy

Overview
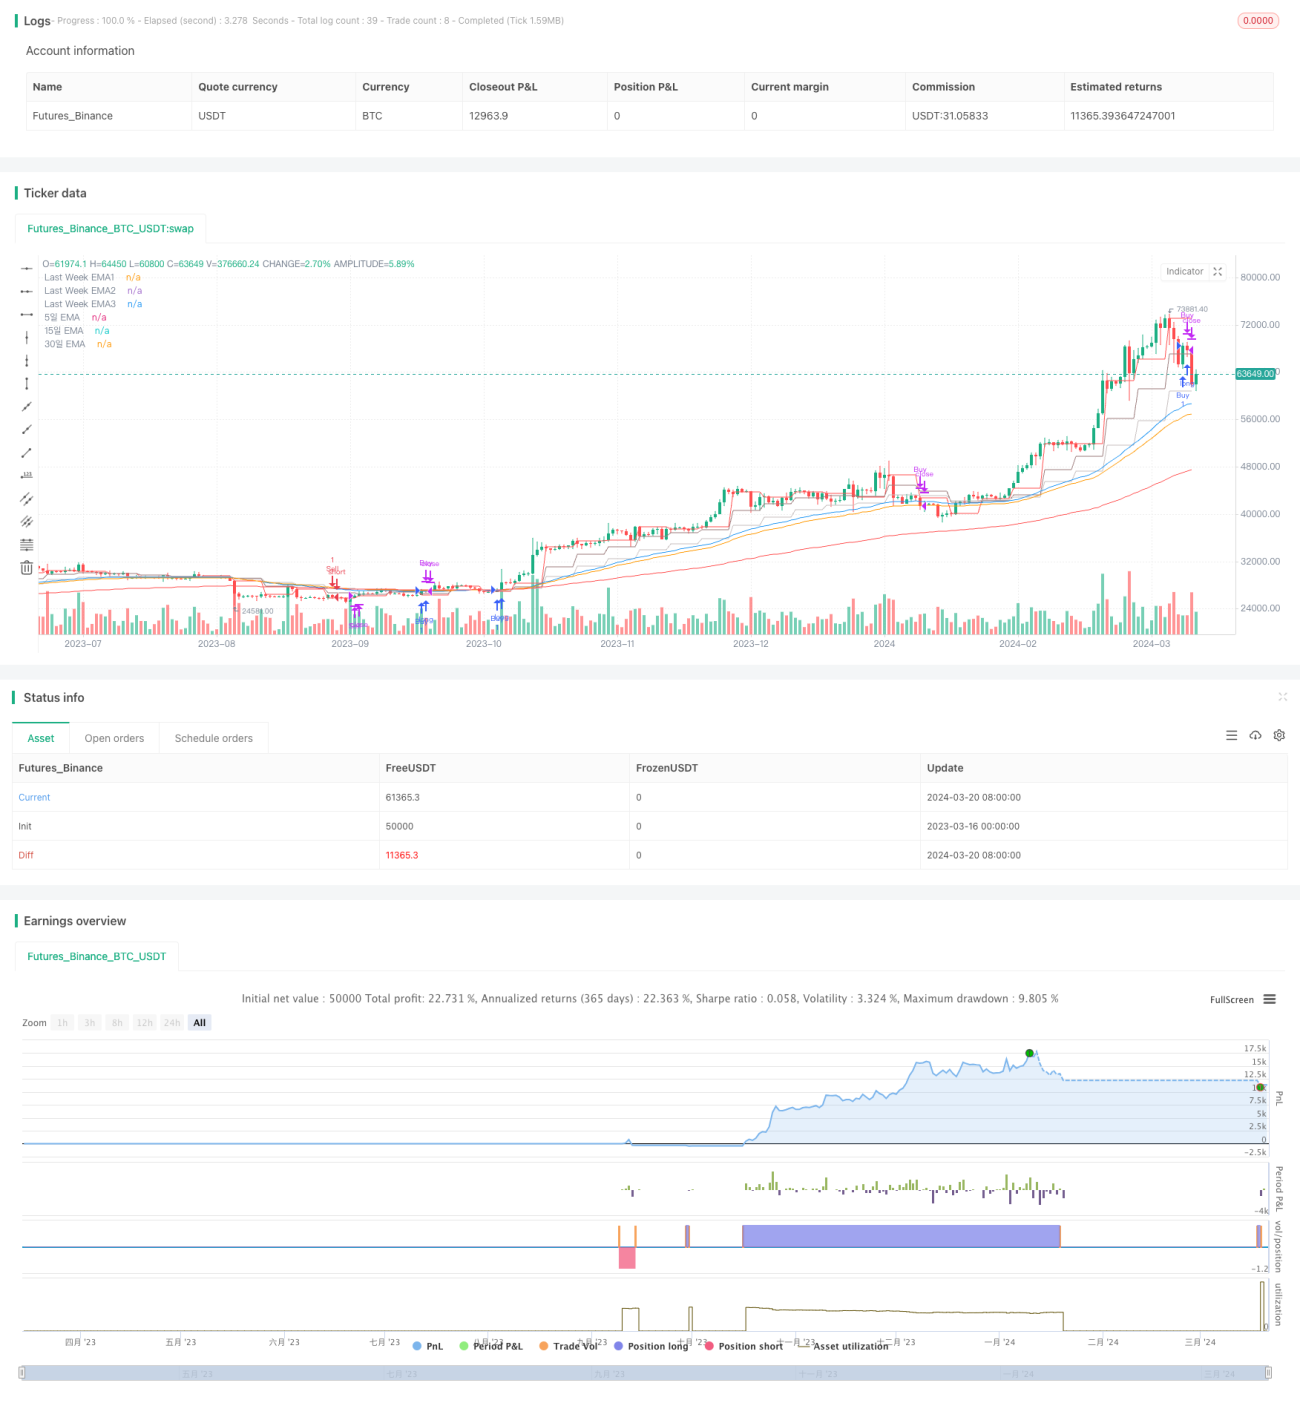
This strategy combines the MACD indicator and multiple EMA lines to capture strong market trends from two timeframes - weekly and intraday. It uses the MACD indicator on the weekly chart to determine the overall trend direction, and three EMA lines (5-day, 15-day, 30-day) on the intraday chart to confirm the trend and make trades at breakout points. The main idea is to follow strong trends and ride the big waves, entering trades when the short-term EMA breaks above the long-term EMA, and exiting when the EMAs pull back or stop-loss conditions are triggered.
Strategy Principle
-
Weekly MACD determines overall trend: Calculate the weekly MACD indicator and compare the difference between the current week's and previous week's MACD histogram values. A positive difference indicates an uptrend, while a negative difference indicates a downtrend. Update the trend direction every Monday at market open.
-
Multiple EMA lines confirm trend: Plot the 5-day, 15-day and 30-day EMA lines on the intraday chart. When the short-term EMA runs above and away from the long-term EMA, the trend is up; conversely, the trend is down.
-
Trade at EMA crossover points:
- Long entry: When the weekly MACD trend is up and the intraday close crosses above the 15-day EMA, go long. Set the stop-loss at a fixed points below the entry price, or exit when the 5-day EMA crosses below the 15-day EMA.
- Short entry: When the weekly MACD trend is down and the 5-day EMA crosses below the 30-day EMA, go short. Set the stop-loss at a fixed points above the entry price, or exit when the 5-day EMA crosses above the 15-day EMA.
-
Adding positions: No additional entry conditions set for now.
Advantage Analysis
-
Combining two timeframes makes the trend determination more reliable. The weekly MACD avoids getting stuck in range-bound markets, while the intraday EMA crossovers capture each wave within the trend.
-
The choice of 5/15/30-day EMAs on the intraday chart effectively filters out noise and captures clear trends.
-
The stop-loss settings are reasonable, controlling risk on individual trades. Combining fixed point stop-loss with EMA stop-loss allows both loss control and trend following.
-
The modular code design, with key components like MACD and EMA calculations, is highly reusable and extensible.
Risk Analysis
-
Improper selection of the MACD histogram difference threshold may lead to overly loose or strict trend criteria, causing misjudgments. Backtesting and parameter optimization can help select the optimal threshold.
-
Improper selection of intraday EMA parameters - too short may lead to overtrading, while too long may miss opportunities. Backtesting and parameter optimization can help select the optimal parameter combination.
-
Improper fixed stop-loss points - setting it too tight may lead to frequent stop-outs, while too wide may lead to excessive losses per trade. Customized stop-loss based on the volatility characteristics of each instrument can help.
-
EMAs may lag at trend turning points, potentially missing the best entry/exit points. But in the long run, it can still effectively control risks and produce good overall performance.
Optimization Directions
-
Consider adding other indicators like RSI on top of the weekly MACD to confirm trend strength and improve accuracy.
-
Consider adding other indicators like CCI as additional filters for the intraday EMA crossover signals to reduce trading frequency and risk.
-
Set customized stop-loss points based on the historical volatility of each stock to better suit its characteristics.
-
Consider adding strategy rules for scaling in and out of positions - gradually adding on strong trends and reducing on weakening trends to improve capital efficiency.
Summary
The MACD+EMA Multi-Timeframe Breakout Strategy is a trend-following strategy with a scientific basis for both trend determination and confirmation. It can effectively capture the main market trends and generate stable returns. Meanwhile, the strategy is quite complete in risk control, effectively limiting drawdowns through reasonable stop-loss and exit rules. However, there are also some shortcomings, such as lagging trend signals and lack of scaling rules, which can be further optimized and improved upon. Overall, this is a very worthwhile quantitative trading strategy to learn and utilize.
- 1