Dynamic Price Zone Breakout Trading Strategy Based on Support and Resistance Quantitative System

Overview
This strategy is a quantitative trading system based on price range breakouts. It operates by dynamically setting upper and lower price limits and executing trades when prices break through these key levels. The core concept is to capture trending opportunities when the market breaks out of established price ranges while adapting to market changes through dynamic adjustment of price zones. The strategy employs flexible position management, allowing additional trades in the same direction to maximize profits from major trends.
Strategy Principles
The strategy operates based on the following core mechanisms: First, it sets appropriate step sizes for different trading instruments, typically around 1.5% of the instrument's price. The system establishes price zones above and below the current price, triggering long signals when prices break above the upper limit and short signals when breaking below the lower limit. After each breakout, the price zones adjust to adapt to the new market environment. The strategy supports adding positions in the same direction, allowing up to 200 positions, enabling profit maximization during strong trends. Order processing includes multiple safeguards, including processing at bar close, recalculating after trade execution, and computing at every price tick.
Strategy Advantages
- Strong Dynamic Adaptation: Price zones automatically adjust with market changes, allowing the strategy to adapt to different market conditions.
- Excellent Trend Following Capability: Through allowing additional positions in the same direction, the strategy can fully capitalize on strong trends.
- Comprehensive Risk Control: Clear stop-loss conditions are set, automatically closing positions when prices break below the zone.
- Wide Applicability: The strategy can be applied to various markets through appropriate step size parameters for different trading instruments.
- High Computational Efficiency: Employs variable persistence and efficient calculation methods to ensure smooth strategy operation.
Strategy Risks
- Choppy Market Risk: Frequent false breakouts in range-bound markets may lead to consecutive stops.
- Position Management Risk: Adding positions in the same direction may lead to over-concentration, requiring proper control of directional risk exposure.
- Slippage Risk: Significant slippage during volatile periods may affect strategy performance.
- Parameter Sensitivity: The effectiveness of the strategy directly depends on appropriate step size settings, requiring thorough testing.
Strategy Optimization Directions
- Incorporate Volatility Indicators: Dynamically adjust step sizes based on market volatility to improve strategy adaptability.
- Add Filtering Mechanisms: Include trend confirmation indicators to reduce losses from false breakouts.
- Enhance Position Management: Design more detailed position control mechanisms to balance returns and risks.
- Optimize Order Execution: Add smart order routing to reduce slippage impact.
- Include Time Dimension: Consider market time characteristics to adjust strategy parameters during different periods.
Summary
This is a well-designed trend following strategy with clear logic. Through dynamic price zone settings and adjustments, combined with flexible position management, the strategy can effectively capture market trending opportunities. While there is room for optimization, overall, the strategy provides a robust quantitative trading framework. Through continuous optimization and improvement, strategy performance can be further enhanced. The strategy design thoroughly considers various aspects of practical trading, including order processing and computational efficiency, demonstrating strong practicality.
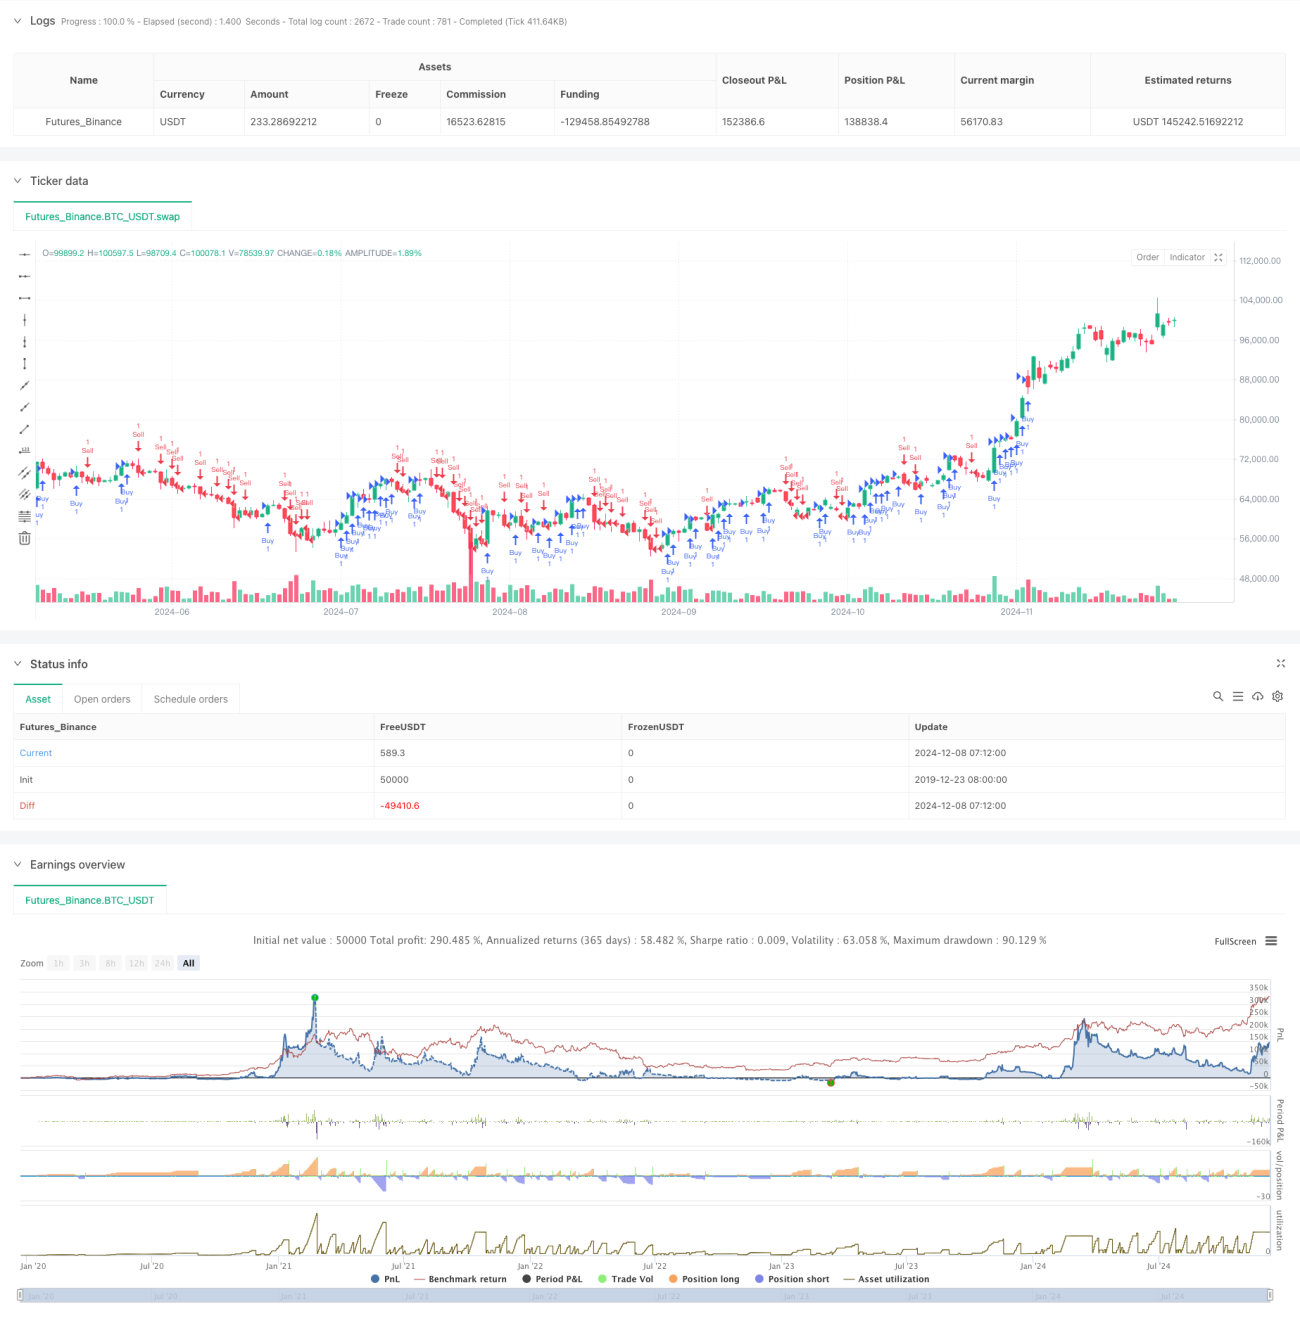
/*backtest
start: 2019-12-23 08:00:00
end: 2024-12-09 08:00:00
period: 1d
basePeriod: 1d
exchanges: [{"eid":"Futures_Binance","currency":"BTC_USDT"}]
*/

// @version=5
// 每个图表上画对应间隔的横线,自己手画吧
// 同方向追加20单,订单成交后重新计算,每个tick重新计算,变量保存1000个周期,k线结束后再处理一次订单,按照代码顺序来绘制plot
strategy("Price Level Breakout Strategy", overlay=true, pyramiding=200, calc_on_order_fills=true, calc_on_every_tick=true, max_bars_back=1000, process_orders_on_close=true, explicit_plot_zorder=true)- 1