
Overview
This strategy is a hybrid system combining trend following and swing trading, achieving stable trading through multiple technical indicator screening and strict capital management. The strategy adopts a stepped take-profit approach to lock in profits while setting maximum drawdown control to manage risk while ensuring returns. The system uses RSI momentum indicator and ADX trend strength indicator as the main trading signal triggers, combined with volume, ATR, and EMA multiple filters to ensure trading effectiveness.
Strategy Principle
The core logic of the strategy includes the following key elements:
- Entry conditions require simultaneous satisfaction: trading volume greater than 1M, ADX greater than 25 indicating clear trend, RSI greater than 60 showing strong momentum, ATR greater than 2 ensuring sufficient volatility range, price above 200-day moving average maintaining uptrend.
- Stepped take-profit design: first take-profit at 15%, closing 50% position; second take-profit at 30%, closing remaining position. This design both locks in partial profits early and doesn't miss big trends.
- Stop-loss control: 15% stop-loss position protects capital, while also exiting when RSI falls below 50 or price breaks below 200 MA.
- Drawdown management: real-time tracking of strategy equity, triggering systemic risk control and clearing all positions when drawdown exceeds 30%.
Strategy Advantages
- Multiple technical indicators cross-validation improves trading signal reliability
- Stepped take-profit design balances short-term profit and capturing major trends
- Complete risk control system, including individual stock stop-loss and systemic risk control
- Strict trading conditions effectively filter false signals
- Clear strategy logic, easy to adjust parameters based on market conditions
Strategy Risks
- Multiple indicator filtering may miss some trading opportunities
- Frequent stop-losses may be triggered in oscillating markets
- Fixed percentage stop-loss and take-profit settings may not suit all market environments
- Strategy relies on technical indicators, may have insufficient response to fundamental sudden events
- Requires larger capital scale to meet trading volume requirements
Strategy Optimization Directions
- Introduce adaptive stop-loss and take-profit mechanisms, dynamically adjusting based on market volatility
- Add market environment judgment module, using different parameter settings under different market conditions
- Optimize ADX calculation method, consider using adaptive periods
- Include transaction cost consideration, optimize position management system
- Develop machine learning-based signal filtering mechanism
Summary
This strategy is a comprehensive trading system achieving stable trading through multiple technical indicators and strict capital management. The core advantages of the strategy lie in its complete risk control system and stepped take-profit mechanism, but attention needs to be paid to timely parameter adjustments based on market conditions in practical application. The strategy's further optimization space mainly lies in parameter dynamic adaptation and signal filtering mechanism improvement.
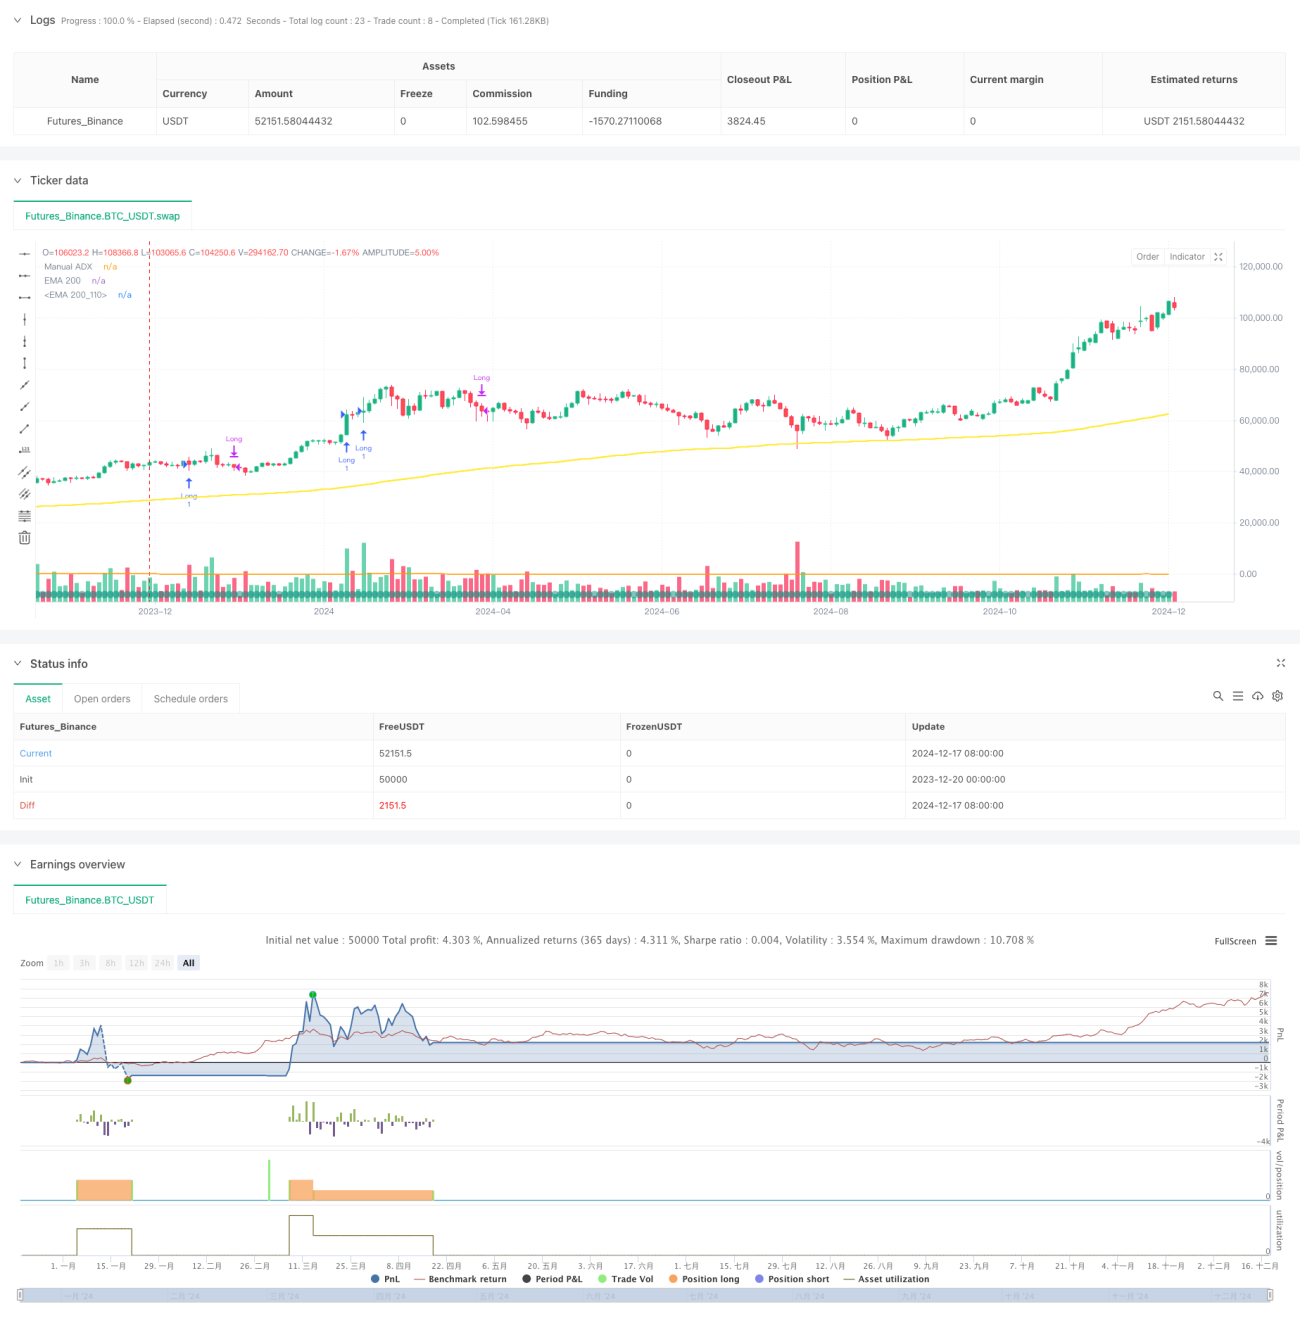
/*backtest
start: 2023-12-20 00:00:00
end: 2024-12-18 08:00:00
period: 2d
basePeriod: 2d
exchanges: [{"eid":"Futures_Binance","currency":"BTC_USDT"}]
*/

//@version=5
strategy(title="Swing Strategy (<30% DD)", shorttitle="SwingStratDD", overlay=true)

//------------------------------------------------------ 1