Parabolic SAR and Bollinger Bands Trend Identification Quantitative Trading Strategy

Overview
The Parabolic SAR and Bollinger Bands Trend Identification Quantitative Trading Strategy is a quantitative trading approach that combines the Parabolic SAR indicator with Bollinger Bands. This strategy identifies market trend direction using Parabolic SAR while utilizing Bollinger Bands to determine price volatility ranges. When prices meet specific conditions, buy or sell signals are generated. The core concept is to confirm trends before entering positions while avoiding extreme price levels, thereby reducing risk and improving trade success rates.
Strategy Principles
This strategy is based on the synergistic effect of two core technical indicators:
-
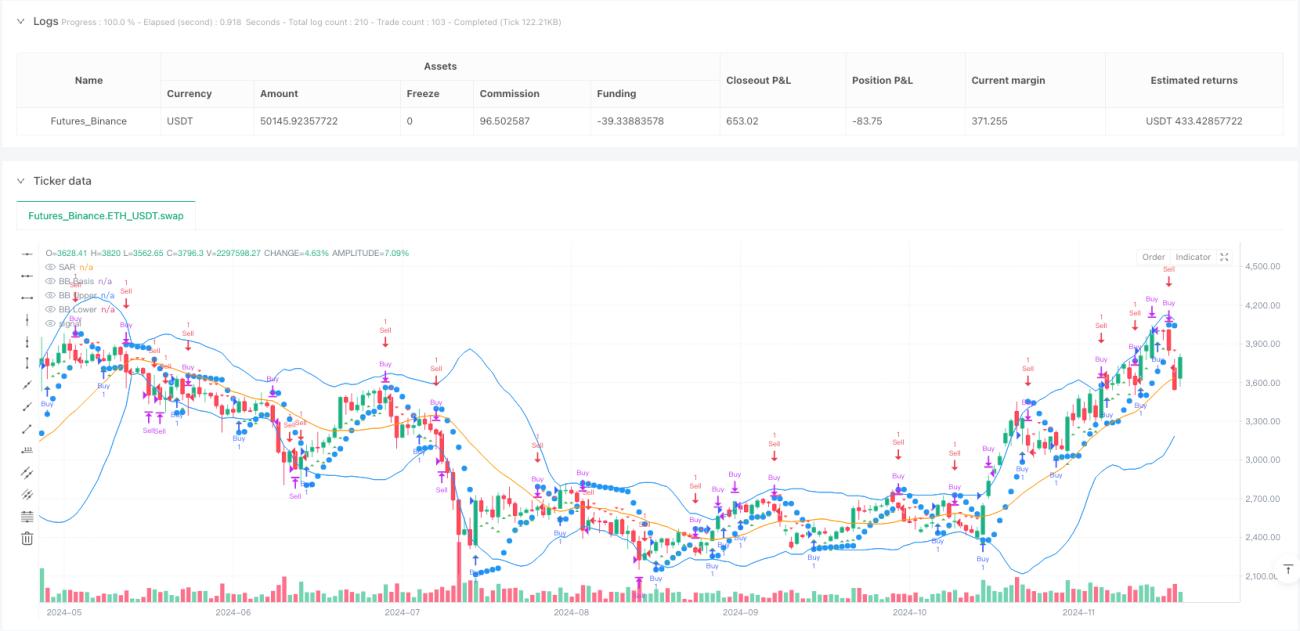
Parabolic SAR (Stop and Reverse): This trend-following indicator appears as dots on a price chart, typically used to identify potential price reversal points and set stop-loss positions. When the price is above the SAR dots, it indicates an uptrend; when price is below the SAR dots, it indicates a downtrend.
-
Bollinger Bands: This volatility indicator consists of three lines: the middle band (typically a 20-period moving average), the upper band (middle band plus two standard deviations), and the lower band (middle band minus two standard deviations). Bollinger Bands help identify whether prices are in overbought or oversold territories.
The trading logic works as follows:
- Buy Condition: When the closing price is above the SAR point (indicating an uptrend) AND below the upper Bollinger Band (avoiding buying in overbought areas), the system generates a buy signal.
- Sell Condition: When the closing price is below the SAR point (indicating a downtrend) AND above the lower Bollinger Band (avoiding selling in oversold areas), the system generates a sell signal.
- Exit Conditions:
- Long exit: When the closing price falls below the SAR point (trend reversal) or reaches/exceeds the upper Bollinger Band (reaching overbought territory).
- Short exit: When the closing price rises above the SAR point (trend reversal) or reaches/falls below the lower Bollinger Band (reaching oversold territory).
This combination leverages the dual advantages of trend confirmation and volatility range assessment, effectively avoiding false signals that might arise from using a single indicator.
Strategy Advantages
-
Combination of Trend Confirmation and Volatility Protection: By confirming trends with Parabolic SAR while using Bollinger Bands to avoid entering at extreme price levels, this dual-filtering mechanism effectively reduces false signals and improves trade quality.
-
Strong Adaptability: The Parabolic SAR's step and maximum parameters can be adjusted to adapt to different market environments; similarly, the Bollinger Bands' period and multiplier can be customized based on market volatility characteristics.
-
Visual Clarity: The strategy provides clear visual signals by plotting indicator lines and trade signal shapes on the chart, allowing traders to intuitively understand trading logic and entry points.
-
Built-in Risk Management: The strategy's exit rules incorporate risk management mechanisms, automatically closing positions when trends reverse or prices reach extreme levels, helping to control the range of losses in individual trades.
-
Applicable to Multiple Timeframes and Markets: The design principles of this strategy make it applicable to different timeframes and market types, particularly suitable for markets with distinct trend characteristics.
Strategy Risks
-
Poor Performance in Ranging Markets: In sideways or choppy markets with no clear trends, this strategy may generate frequent and incorrect signals, resulting in multiple small losses. A solution is to add a trend strength filter, such as the ADX indicator, activating the strategy only when trend strength is sufficient.
-
Parameter Sensitivity: Strategy performance is highly sensitive to parameters such as SAR step, SAR maximum, Bollinger Band period, and multiplier. Improper parameter settings may lead to premature entries or delayed exits. It is recommended to find optimal parameter combinations for specific markets through historical backtesting.
-
Lag Issues: Since both SAR and Bollinger Bands are indicators calculated based on historical data, they may exhibit certain lag in rapidly changing markets, missing optimal entry points or delaying exits. Consider reducing indicator periods to decrease lag, though this may increase false signals.
-
Lack of Volume Confirmation: The current strategy does not consider volume factors, which are often important indicators for confirming price trend reliability. Adding volume filter conditions is recommended, such as requiring increased volume when trends change.
-
Insufficient Stop Loss Settings: Although the strategy has built-in exit conditions, it lacks fixed stop-loss positions, which may lead to significant losses under extreme market conditions. Consider adding hard stop-loss settings based on percentages or ATR.
Strategy Optimization Directions
-
Add Trend Filters: Introduce ADX (Average Directional Index) or similar indicators, executing trades only when ADX is above a specific threshold (e.g., 25) to avoid false signals in trendless markets. This optimization can significantly reduce losing trades in ranging markets.
-
Optimize Entry Timing: Consider adding RSI or stochastic indicators as auxiliary confirmation on top of current entry conditions, for example, buying only when RSI rebounds from oversold territory in uptrends, to get better entry prices.
-
Add Volume Confirmation: Require entry signals to be accompanied by increased volume; consider using Volume Weighted Moving Average (VWMA) instead of Simple Moving Average (SMA) to calculate Bollinger Bands, or separately check if volume is above its moving average.
-
Dynamic Stop Loss Strategy: Implement trailing stop functionality, for example, gradually moving stop loss points to SAR positions in profitable trades to protect profits while allowing trends to continue developing.
-
Consider Time Filters: Some markets have better volatility and liquidity during specific time periods; the strategy could add time filters to execute trading signals only during the most favorable trading sessions.
-
Enhance Position Sizing: Dynamically adjust position sizes based on market volatility (such as ATR) or account risk percentage, increasing positions during low volatility periods and reducing them during high volatility periods to achieve a more balanced risk-reward ratio.
-
Add Multi-Timeframe Confirmation: Use multi-timeframe analysis, requiring signal directions to be consistent across larger and smaller timeframes, which can reduce false breakout signals.
Summary
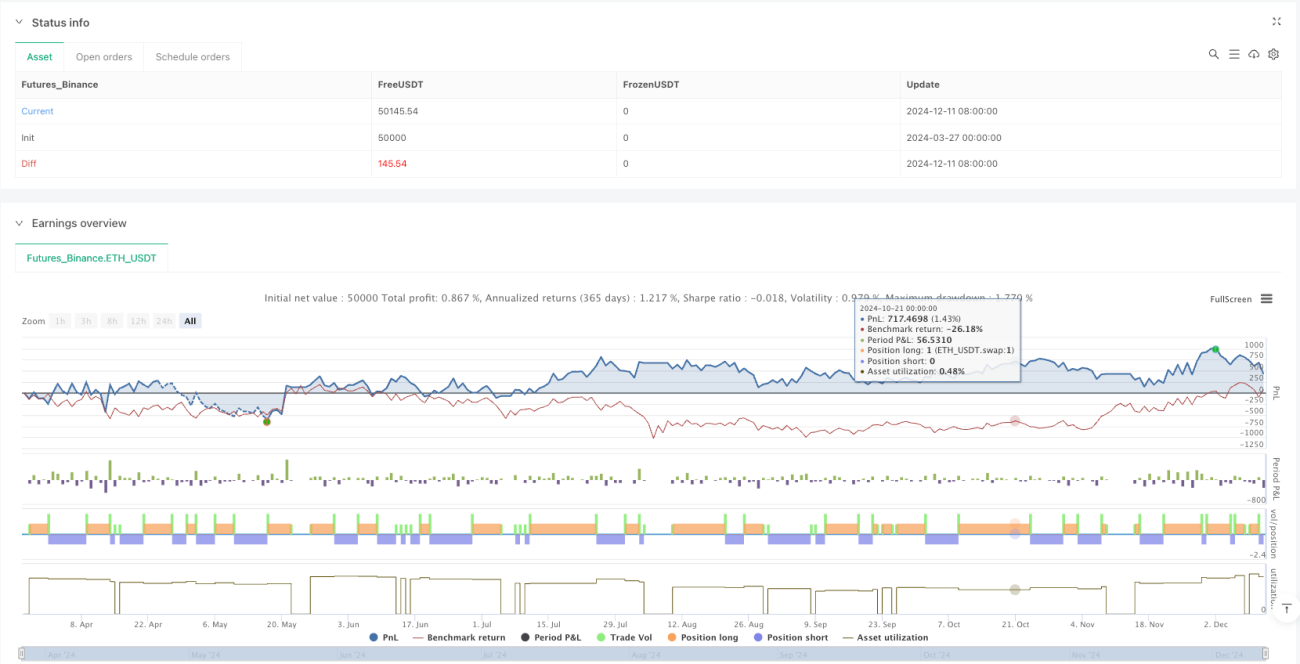
The Parabolic SAR and Bollinger Bands Trend Identification Quantitative Trading Strategy cleverly combines trend following and volatility range assessment trading concepts. It identifies market trend direction through Parabolic SAR and controls entry zones with Bollinger Bands, effectively avoiding the risks of entering against trends or at extreme price levels. This strategy has advantages including visual intuitiveness, adjustable parameters, and built-in risk management, but it may not perform well in ranging markets and is sensitive to parameter settings.
By introducing trend strength filtering, volume confirmation, dynamic stop losses, and multi-timeframe analysis, the strategy's stability and profitability can be further enhanced. In particular, adding trend strength indicators like ADX and optimizing position management may significantly improve strategy performance.
This strategy is suitable for quantitative traders with some trading experience who can adjust parameters and add personalized optimization measures based on the specific characteristics of the markets they trade, thereby building a more robust trading system. Ultimately, as with all trading strategies, strict money management and emotional control are key factors in successfully applying this strategy.
- 1