Multi-Indicator Adaptive Volatility ATR Dynamic SL/TP 15-Minute Chart Trend Following Strategy

Overview
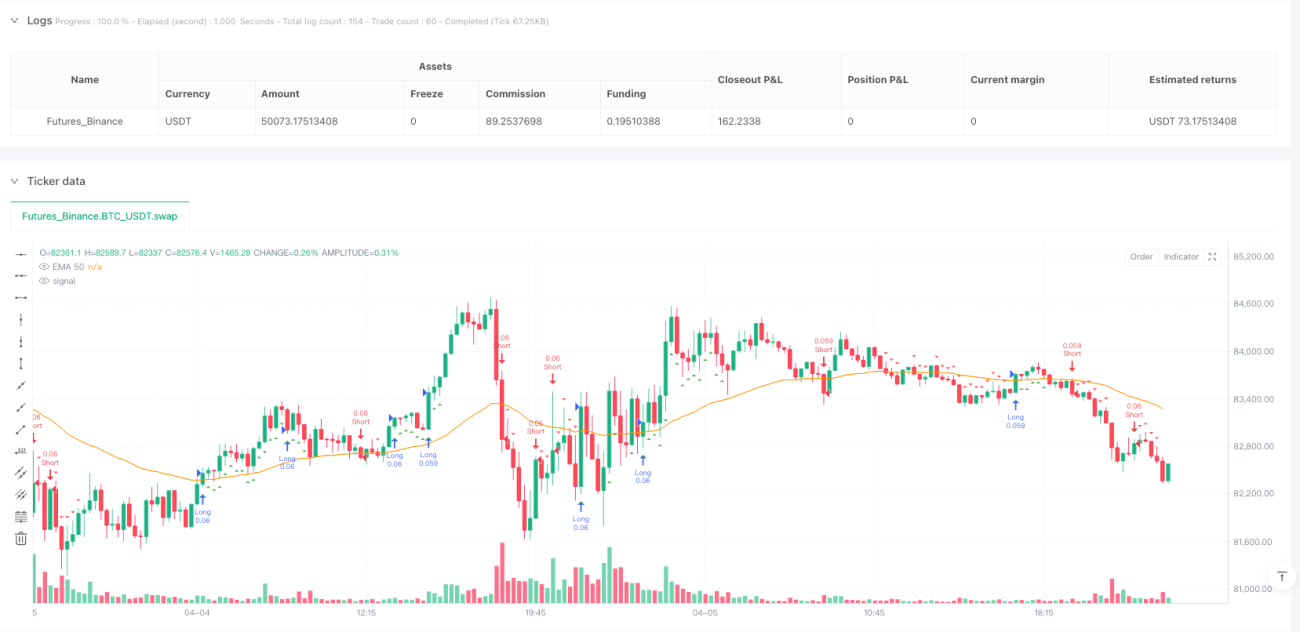
This strategy is a short-term trading approach designed for 15-minute charts, combining trend following with momentum confirmation mechanisms, while utilizing dynamic stop-loss and take-profit levels based on market volatility. The core idea is to identify the main trend direction using EMA(50), confirm momentum direction with MACD histogram, filter overbought/oversold conditions using RSI indicator, and dynamically set stop-loss and take-profit positions using ATR indicator based on market volatility. This multi-indicator approach provides a more comprehensive market analysis perspective, helping to capture high-probability trading opportunities in short-term price movements.
Strategy Principles
The operation of this strategy is based on the synergistic effect of multiple technical indicators:
-
Trend Identification: Uses a 50-period Exponential Moving Average (EMA) as the primary trend indicator. When price is above the EMA, an uptrend is identified; when price is below the EMA, a downtrend is identified.
-
Momentum Confirmation: Judges price momentum through the MACD Histogram. Positive values indicate upward momentum, while negative values indicate downward momentum. This indicator is calculated from the fast line (12 periods), slow line (26 periods), and signal line (9 periods).
-
Market State Filtering: Uses the Relative Strength Index (RSI) to filter overbought/oversold conditions. RSI between 50-70 is considered bullish but not excessively overbought, while RSI between 30-50 is considered bearish but not excessively oversold.
-
Risk Management: Dynamically sets stop-loss and take-profit levels based on Average True Range (ATR). Stop-loss is set at 1x ATR, and take-profit at 2x ATR, adjustable according to personal risk preference.
Entry conditions are clearly defined:
- Long Entry: Price above EMA 50 + MACD histogram positive + RSI above 50 but below 70
- Short Entry: Price below EMA 50 + MACD histogram negative + RSI below 50 but above 30
This multi-layered combination of conditions ensures the quality of trading signals, effectively reducing false signals.
Strategy Advantages
Through in-depth code analysis, this strategy demonstrates several significant advantages:
-
Multiple Confirmation Mechanisms: Combines indicators from three dimensions—trend, momentum, and overbought/oversold—forming multiple confirmation mechanisms that reduce false signals and improve trading accuracy.
-
Adaptive Risk Management: Uses ATR to dynamically adjust stop-loss and take-profit levels, allowing the strategy to adapt to different market volatility conditions, automatically widening stop-loss ranges in highly volatile markets and narrowing them in low-volatility markets.
-
Clear Trading Logic: Entry and exit conditions are clearly defined with no subjective judgment factors, making the strategy easy to execute and backtest.
-
Flexible Parameter Adjustment: All key parameters can be customized, including EMA length, MACD parameters, RSI thresholds, and ATR multipliers, allowing the strategy to adapt to different market environments and personal trading styles.
-
Visualization of Trading Signals: The code includes signal visualization features that intuitively display entry points on the chart, aiding in strategy understanding and optimization.
-
Fixed Risk-Reward Ratio: By setting take-profit at twice the stop-loss, the strategy ensures a favorable risk-reward ratio, contributing to long-term profitability.
Strategy Risks
Despite its reasonable design, the strategy still has the following potential risks:
-
Poor Performance in Ranging Markets: In sideways, choppy markets, the strategy may generate multiple false signals, leading to consecutive losses. The solution is to add additional filtering conditions for ranging markets or pause trading during obvious consolidation periods.
-
False Breakout Risk: Price briefly breaking above/below the EMA before quickly retracing can trigger false signals. Consider adding confirmation periods or incorporating volume indicators to filter out false breakouts.
-
Limitations of Fixed ATR Multipliers: Although ATR can adapt to volatility changes, fixed multipliers may be too large or too small under certain market conditions. A solution is to dynamically adjust ATR multipliers based on historical volatility.
-
Parameter Optimization Overfitting Risk: Excessive optimization of indicator parameters may cause the strategy to perform well on historical data but fail in live trading. It's recommended to use step-by-step optimization and forward validation to mitigate this risk.
-
Extreme Market Risk: In cases of severe market volatility or gaps, stop-losses may not execute as expected, causing losses beyond expectations. Consider setting maximum stop-loss amounts as additional protection.
Strategy Optimization Directions
After analyzing the code, the following potential optimization directions were identified:
-
Add Time Filtering Conditions: Consider market activity levels by adding time filters to only trade during specific periods, avoiding low-liquidity or high-volatility sessions. This can be implemented by adding time condition judgment code.
-
Integrate Volume Confirmation: The current strategy is based solely on price indicators. Volume indicators could be added as additional confirmation to improve signal quality. Specifically, logic comparing volume with its moving average could be added.
-
Dynamically Adjust ATR Multipliers: Automatically adjust stop-loss and take-profit ATR multipliers based on historical market volatility, increasing multipliers during high-volatility periods and decreasing them during low-volatility periods. This can be implemented by calculating volatility indicators (such as the standard deviation of daily true ranges).
-
Add Trend Strength Filtering: Use trend strength indicators like ADX to only trade when trends are clear, avoiding false signals in ranging markets. This can be implemented by adding ADX condition judgments.
-
Introduce Trailing Stops: The current strategy uses fixed stop-losses. Consider implementing ATR-based trailing stops to lock in partial profits. This requires modifying the strategy.exit section to add trailing stop logic.
-
Partial Profit-Taking Mechanism: Consider staged profit-taking, such as closing 50% of the position at 1x ATR and the remaining position at 2x ATR, to improve overall profitability. This requires modifying the trade execution section to implement partial position closing functionality.
Summary
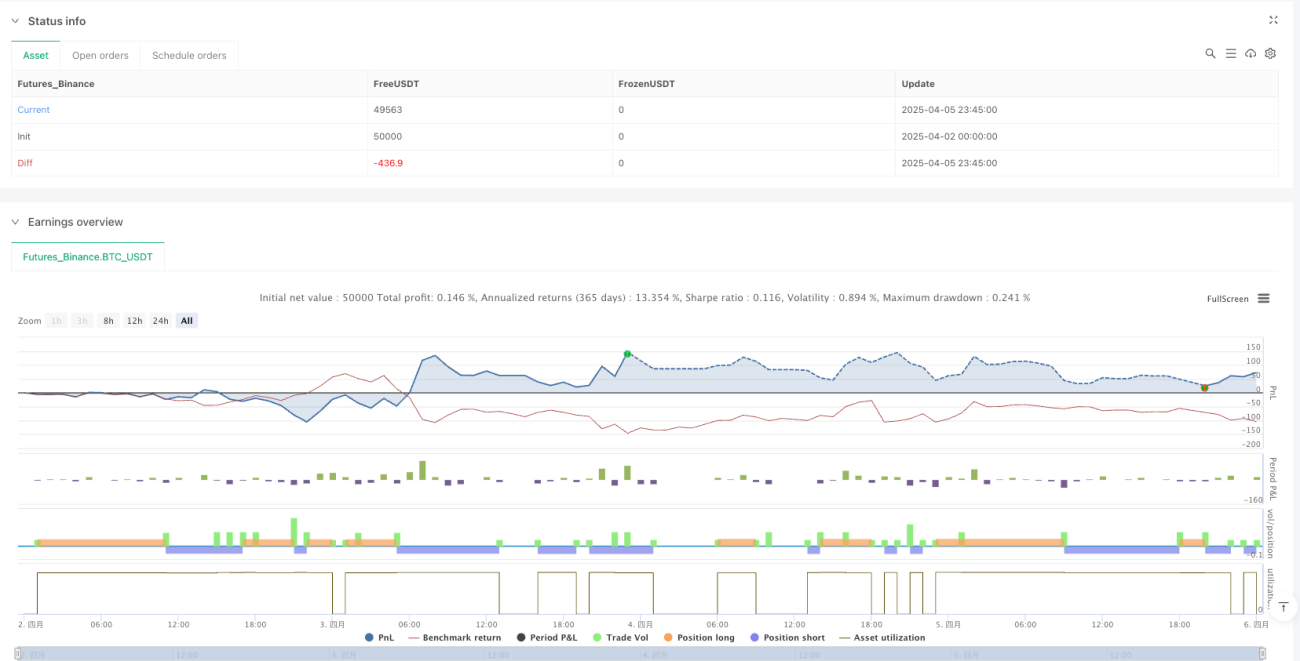
The Multi-Indicator Adaptive Volatility ATR Dynamic SL/TP 15-Minute Chart Trend Following Strategy is a well-designed short-term trading system that provides high-quality entry signals through the combination of EMA, MACD, and RSI, and implements dynamic risk management using ATR. This strategy is particularly suitable for market environments with clear trends and adapts well to rapidly changing trading instruments.
The core advantages of the strategy lie in its multiple confirmation mechanisms and adaptive risk management, while its main limitations are in ranging market performance and parameter optimization challenges. By introducing volume confirmation, trend strength filtering, and dynamic parameter adjustments, the stability and profitability of the strategy can be further enhanced.
For traders, this is a strategy framework with clear logic that is easy to understand and execute, and can serve as a good foundation for building personal trading systems. However, any strategy should undergo thorough backtesting and forward testing before live application, and should be appropriately adjusted according to personal risk tolerance and market environment.
/*backtest
start: 2025-04-02 00:00:00
end: 2025-04-06 00:00:00
period: 15m
basePeriod: 15m
exchanges: [{"eid":"Futures_Binance","currency":"BTC_USDT"}]
*/

//@version=5
strategy("Scalping 15min: EMA + MACD + RSI + ATR-based SL/TP", overlay=true, default_qty_type=strategy.percent_of_equity, default_qty_value=10)

// === INPUTURI ===- 1