Technical Indicator Distance Measurement and MACD Reversal Hybrid Quantitative Trading Strategy

Strategy Overview
This strategy is a hybrid quantitative trading approach that combines technical indicator distance measurement with MACD reversal signals. It calculates the Euclidean distance between the current market state and predefined bullish and bearish centroids, while also incorporating MACD crossover signals to form a composite strategy capable of capturing trend momentum and identifying potential reversals. The strategy's uniqueness lies in combining multiple technical indicators (EMA, volatility, momentum, RSI, and MACD) into feature vectors, quantifying the similarity between the current market state and preset conditions through mathematical methods to generate more precise trading signals.
Strategy Principles
The core principles of this strategy are built on two main mechanisms:
-
Distance Measurement Mechanism: The strategy first constructs a feature vector comprising six technical indicators, including price EMA, volatility, momentum, RSI, MACD line, and MACD histogram. Simultaneously, it predefines two centroid vectors representing bullish and bearish market states, which represent ideal conditions during upward and downward trends. By calculating the Euclidean distance between the current market state vector and these two centroid vectors, the strategy can determine which state the current market more closely resembles.
-
MACD Crossover Signal Mechanism: As a second layer of confirmation, the strategy uses MACD indicator crossover signals to judge momentum changes in the market. MACD line crossing above the signal line is considered a buy signal, while MACD line crossing below the signal line is considered a sell signal.
The combination of these two mechanisms forms a dual confirmation system: one aspect judges the overall market tendency through distance measurement, while the other judges short-term momentum changes through MACD crossovers. The strategy can either utilize the joint confirmation of both mechanisms (when distance measurement and MACD simultaneously provide the same signal) or generate trades based on signals independently produced by either mechanism, increasing signal diversity and opportunity capture frequency.
Strategy Advantages
-
Multi-dimensional Market State Assessment: By combining multiple technical indicators into a feature vector, the strategy can assess market conditions from multiple dimensions rather than relying on a single indicator, thereby reducing the risk of false signals.
-
Flexible Signal Generation Mechanism: The strategy simultaneously uses distance measurement and MACD crossovers to generate signals, allowing it to capture sustained momentum in trending markets while also timely identifying potential reversal points, resulting in stronger adaptability.
-
Objectivity of Mathematical Models: Euclidean distance calculation provides an objective, mathematical method for evaluating market states, reducing the influence of subjective judgment factors.
-
Automatic Position Closing Mechanism: The strategy automatically closes positions in the opposite direction when new signals are generated, helping to implement timely stop-losses and switch position direction, adapting to rapidly changing markets.
-
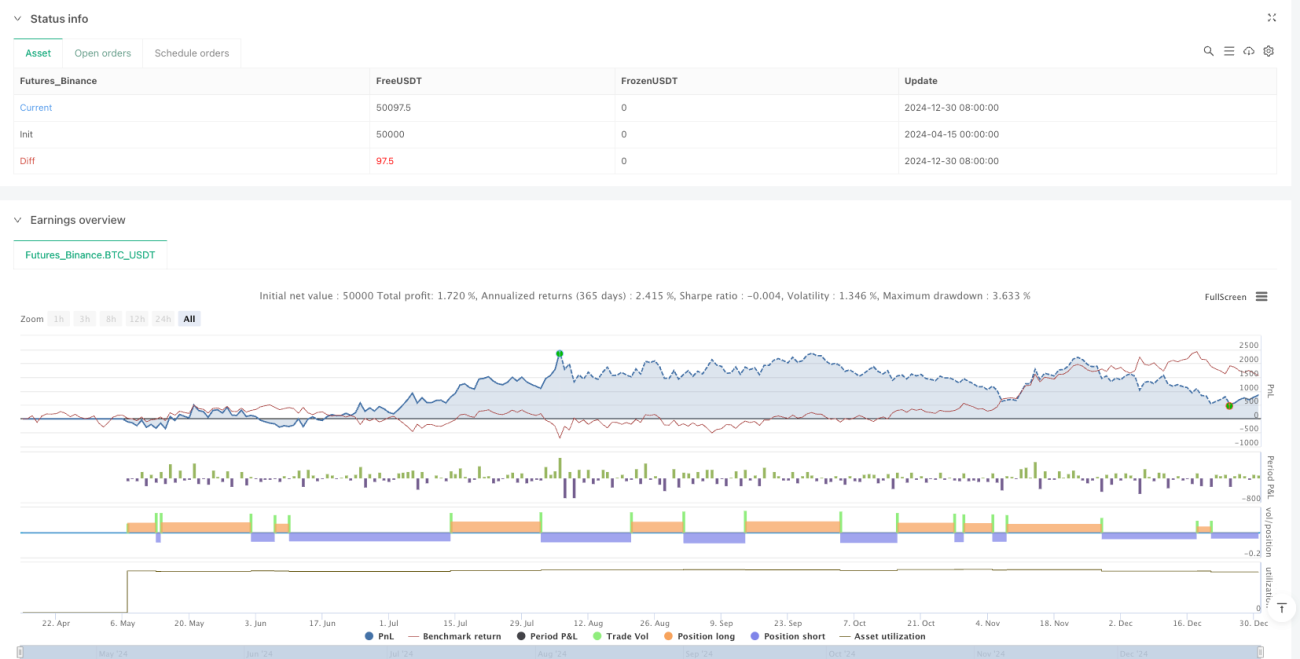
Performance Monitoring Functionality: The strategy has built-in tracking and display functions for trade profits and losses, facilitating real-time assessment of strategy performance and necessary parameter adjustments.
Strategy Risks
-
Parameter Sensitivity Risk: The EMA, RSI, and MACD indicators used in the strategy all depend on specific parameter settings. If these parameters are not suitable for current market conditions, they may lead to erroneous signals. The solution is to find optimal parameter combinations through backtesting and periodically reassess parameter effectiveness.
-
Overtrading Risk: Since the strategy can independently generate signals based on two different mechanisms, it may produce excessive trading signals in highly volatile markets, increasing transaction costs. This can be mitigated by adding signal filtering mechanisms or adjusting signal generation logic to reduce unnecessary trades.
-
Trend and Reversal Judgment Conflicts: Under certain market conditions, distance measurement and MACD signals may provide contradictory indications, causing inconsistent strategy behavior. It is recommended to establish clear signal priority rules or introduce additional confirmation mechanisms.
-
Static Nature of Centroid Settings: Some parameters in the current strategy's bull and bear market centroids are statically set (such as RSI values), which may not adapt to all market environments. Consider introducing adaptive mechanisms to dynamically adjust centroid positions based on historical data.
-
Single Timeframe Limitation: The strategy operates within a single timeframe, potentially missing important signals from larger or smaller timeframes. Expanding to a multi-timeframe strategy can improve signal reliability.
Strategy Optimization Directions
-
Adaptive Centroid Design: Currently, some parameters for bull and bear market centroids are fixed. This could be improved to dynamic centroids automatically calculated based on historical data. For example, data from the past N periods could be used to determine ideal bullish and bearish states, allowing centroids to automatically adjust with market conditions.
-
Signal Priority and Filtering Mechanisms: Introduce a signal priority system based on market environment. For example, prioritize reversal signals in high-volatility environments and distance measurement signals in low-volatility environments with clear trends. Additionally, signal filters based on volatility or volume could be added to reduce noise signals.
-
Stop-Loss and Profit Target Mechanisms: The current strategy lacks clear stop-loss and profit target settings. Consider adding stop-loss mechanisms based on ATR or fixed percentages, as well as profit targets based on support/resistance levels or risk-reward ratios.
-
Multi-Timeframe Analysis Integration: Integrate trend information from larger timeframes into the current strategy. For example, only execute hourly-level trading signals when they align with the daily trend direction to improve signal reliability.
-
Dynamic Adjustment of Feature Weights: Assign dynamic weights to different indicators in the feature vector, automatically adjusting their influence based on each indicator's predictive ability under different market conditions to improve the accuracy of distance calculations.
-
Machine Learning Enhancement: Consider introducing simple machine learning algorithms to optimize centroid positions or feature weights. Clustering algorithms could even be used to automatically discover multiple market state centroids, rather than simply using two bull and bear states.
Summary
The Technical Indicator Distance Measurement and MACD Reversal Hybrid Quantitative Trading Strategy is an innovative quantitative trading method that integrates multiple common technical indicators into a unified market state assessment system through Euclidean distance calculation techniques, combined with MACD crossover signals to form a dual confirmation mechanism. This approach can capture momentum in sustained trends while also identifying potential market reversal points, demonstrating strong adaptability and flexibility.
The core advantages of this strategy lie in its multi-dimensional market assessment capability and the objectivity of its mathematical model. However, it also faces risks such as parameter sensitivity, overtrading, and signal conflicts. The strategy has significant optimization potential through introducing adaptive centroid designs, optimizing signal priority systems, adding stop-loss mechanisms, integrating multi-timeframe analysis, and applying machine learning techniques.
For quantitative traders, this strategy combining traditional technical analysis methods with mathematical models provides a worthwhile new direction to explore, particularly suitable for those who wish to improve the objectivity of trading decisions while maintaining strategy explainability.
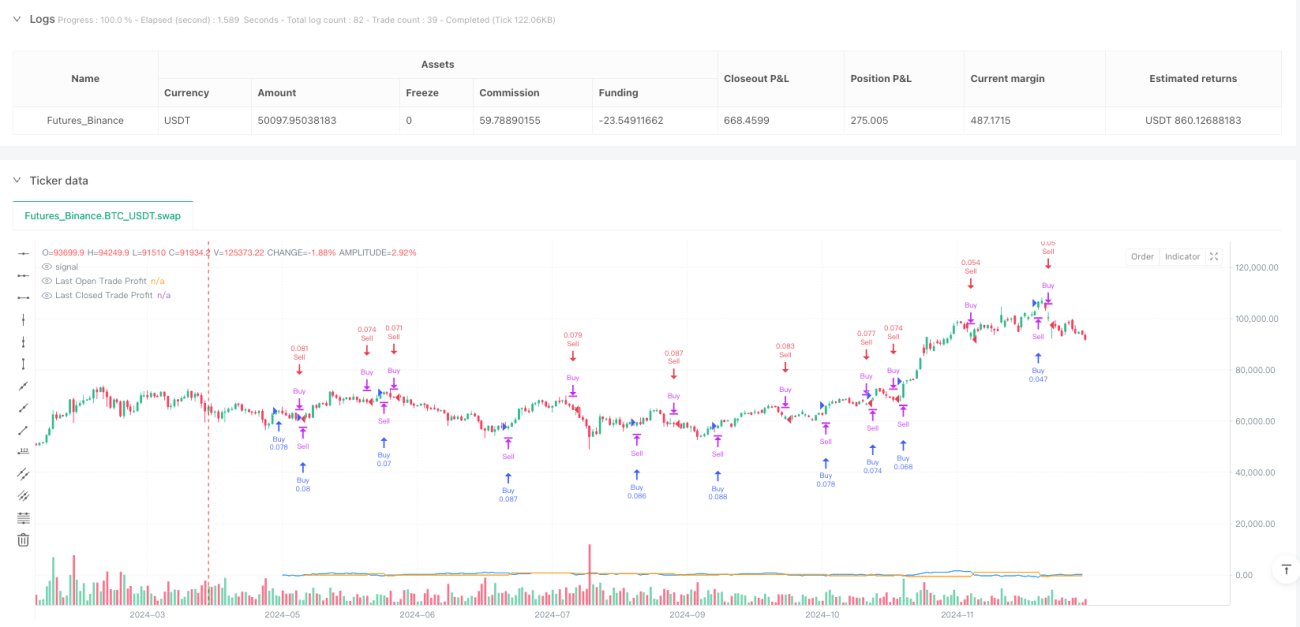
/*backtest
start: 2024-04-15 00:00:00
end: 2024-12-31 00:00:00
period: 1d
basePeriod: 1d
exchanges: [{"eid":"Futures_Binance","currency":"BTC_USDT"}]
*/

//@version=6
strategy("Bysq-Distance Reversal Entry - BTCUSDT (v6)", overlay=true, default_qty_type=strategy.percent_of_equity, default_qty_value=10, margin_long=0, margin_short=0)

// ========== FEATURE ENGINEERING ==========- 1