Volume-Volatility Composite Index Trend Following Strategy

Overview
The Volume-Volatility Composite Index Trend Following Strategy is a quantitative trading system based on the relationship between trading volume and price volatility. This strategy creates a composite index by calculating the interrelationship between trading volume and price fluctuations to capture market momentum changes, while confirming trend direction through short-term and long-term moving average crossovers. Its core lies in identifying key market turning points where trading volume abnormally increases accompanied by expanded price volatility, while also utilizing Fibonacci ratios to manage risk and profit targets. This system can be used for both trend following and, through the reversal mode setting, for adding positions during trends, achieving a flexible trading strategy adaptable to different market environments.
Strategy Principles
The core calculation logic of this strategy includes the following key steps:
-
Volume Analysis: Uses Simple Moving Average (SMA) to calculate volume average (vol_ma), and compares current volume with the average to obtain a percentage indicator (vol_percent = volume / vol_ma * 100).
-
Volatility Calculation: Quantifies price volatility by calculating the ratio of the candlestick range to the closing price (volatility = (high - low) / close * 100).
-
Composite Index Construction: Multiplies volume percentage by volatility to create a composite indicator (volatility_index = volume * volatility), which simultaneously reflects both volume and price volatility anomalies.
-
Moving Average System: Calculates short-term (index_short_ma) and long-term (index_long_ma) moving averages of the composite index, and applies a sensitivity magnification factor (index_magnification) to increase signal sensitivity.
-
Dynamic Threshold: Constructs a dynamic filtering threshold by multiplying the long-term moving average by a threshold magnification factor (index_threshold_magnification), used to filter market noise.
-
Pattern Recognition: Analyzes a specified number of lookback_bars to detect specific reversal pattern formations, triggering signals when the volatility index shows specific trend changes and price formations meet reversal conditions.
-
Signal Generation:
- Long Signal: Generated when the short-term index moving average crosses above the long-term moving average, the composite index breaks above the dynamic threshold, and reversal pattern conditions are met.
- Short Signal: Generated when the short-term index moving average crosses below the long-term moving average, the composite index falls below the dynamic threshold, and reversal pattern conditions are met.
- Reversal Mode: When the reversal strategy is enabled, short signals can be converted to long signals, used for adding positions in trending markets.
-
Risk Management: Automatically sets take-profit (take_profit) and stop-loss (stop_loss) levels based on Fibonacci ratios, calculated using pattern amplitude (bearish_range), ensuring reasonable risk-reward ratios.
Strategy Advantages
-
Comprehensive Indicator Advantage: By combining trading volume with volatility, this strategy can more comprehensively capture abnormally active market points, avoiding the potential misleading of single indicators.
-
Dynamic Adaptability: Adopts a dynamic threshold mechanism (index_threshold_magnification_auto), enabling the strategy to self-adapt to volatility characteristics under different market conditions, reducing false signals.
-
Pattern Confirmation Mechanism: Enhances signal reliability by retrospectively analyzing candlestick patterns through the lookback_bars parameter, requiring not only indicator crossovers but also compatible price formations, significantly reducing false breakout risks.
-
Flexible Strategy Modes: Can switch between trend-following and reversal strategies through the reversal_s parameter, allowing the system to adapt to different market environments and trading needs.
-
Systematic Risk Management: Stop-loss and take-profit mechanisms based on Fibonacci levels automatically adjust risk parameters according to actual market volatility ranges, avoiding the inflexibility that can come with fixed levels.
-
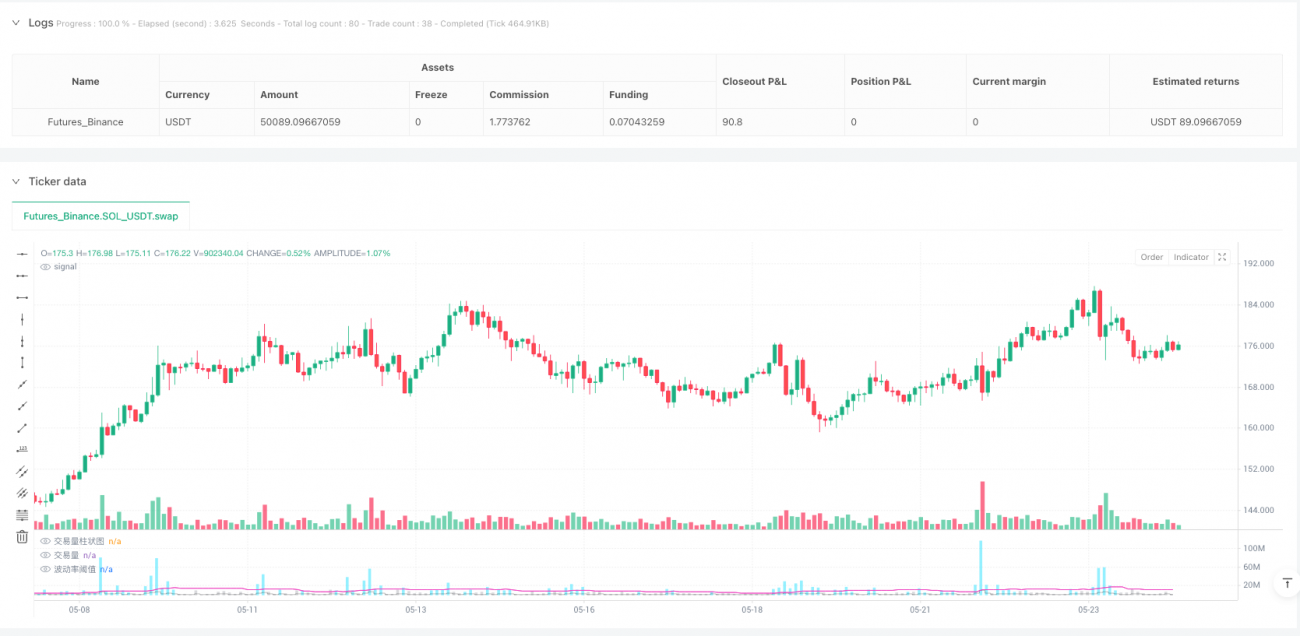
Intuitive Visualization: The strategy provides visualization of volume bars and indicator curves, making trading signals clear and intuitive, facilitating traders' understanding of market conditions and decision-making bases.
-
Adjustable Parameters: Offers multiple adjustable parameters (vol_length, index_short_length, index_long_length, etc.), allowing traders to customize settings based on different market characteristics and personal risk preferences.
Strategy Risks
-
Parameter Sensitivity Risk: The strategy depends on multiple parameter settings, such as volume moving average length (vol_length), index moving average lengths (index_short_length, index_long_length), etc. Improper parameter selection may lead to overfitting or signal delays.
Solution: Conduct historical backtesting optimization to find parameter combinations that perform stably under different market environments, avoiding over-optimization for specific time periods. -
False Breakout Risk: Although the strategy has a dynamic threshold filtering mechanism, situations where the index briefly breaks through the threshold and quickly retreats may still occur in highly volatile markets.
Solution: Increase signal confirmation periods, or combine with other technical indicators (such as RSI, MACD) for multiple confirmations to improve signal reliability. -
Improper Stop-Loss Range Risk: Fibonacci-based stop-loss settings may be insufficient to protect capital safety in extremely volatile markets.
Solution: Add maximum stop-loss percentage limits, or dynamically adjust the stopLossFib parameter based on historical volatility, ensuring risk is controlled within acceptable ranges. -
Trend Judgment Error Risk: In consolidating or oscillating markets, moving average crossover signals may appear frequently, leading to excessive trading.
Solution: Introduce trend strength indicators (such as ADX) to filter signals in weak trend markets, or add trading frequency limitation conditions. -
Liquidity Risk: The strategy is sensitive to volume changes and may produce erroneous signals or face slippage issues in low liquidity markets.
Solution: Add minimum volume threshold conditions to avoid trading in low liquidity environments, or adjust the index sensitivity (index_magnification) to reduce reactions to minor fluctuations. -
Out-of-Sample Performance Risk: The strategy may perform well on historical data, but future market condition changes may lead to performance degradation.
Solution: Use out-of-sample testing and forward testing methods, periodically reassess and adjust strategy parameters to maintain strategy adaptability.
Strategy Optimization Directions
-
Multi-Timeframe Confirmation Mechanism: The current strategy operates only within a single timeframe. Introducing a multi-timeframe analysis framework requiring higher timeframe trend direction to align with trading signals would improve win rates. This would avoid counter-trend operations in major trends, reducing the risk of being "crushed".
-
Market State Classification Processing: Add market state classification mechanisms (trending/oscillating markets) to automatically adjust strategy parameters or trading rules according to different market states. For example, market states can be determined through ATR or volatility indicators, raising threshold requirements in high-volatility environments and relaxing conditions in low-volatility environments.
-
Machine Learning Parameter Optimization: Introduce machine learning algorithms to dynamically optimize strategy parameters, such as using genetic algorithms or reinforcement learning methods to find optimal parameter combinations, enabling the strategy to self-adapt to market changes.
-
Sentiment Indicator Integration: Integrate market sentiment indicators (such as VIX, fund flows, etc.) into the signal generation logic to enhance the ability to predict market turning points. Market sentiment often leads price movements, and combining sentiment indicators can capture market turning signals in advance.
-
Take-Profit Strategy Optimization: Implement a partial profit-taking mechanism, taking profits in batches according to the Fibonacci sequence, both securing partial profits and allowing remaining positions to fully benefit from trend returns. For example, different position percentages could be closed at the 0.382, 0.618, 1.0, 1.618 levels, etc.
-
Trading Cost Consideration: The current strategy does not consider trading costs. Adding trading cost calculation logic would ensure that the expected returns from signals exceed trading costs, avoiding cost erosion from frequent small trades.
-
Risk Position Management: Add a dynamic position sizing module to automatically calculate optimal position sizes based on historical volatility, current signal strength, and account risk tolerance, implementing more scientific fund management.
-
Correlation Filtering: In multi-asset trading scenarios, add a correlation analysis module to avoid simultaneously establishing same-direction positions in highly correlated multiple assets, reducing systemic risk.
Summary
The Volume-Volatility Composite Index Trend Following Strategy innovatively combines trading volume and price volatility indicators to build a quantitative trading system capable of capturing market momentum changes. This strategy excels in identifying potential turning points and trend confirmations, while providing flexible trading execution mechanisms through Fibonacci take-profit and stop-loss management and optional reversal modes.
The core advantages of the strategy lie in its comprehensive indicator system and dynamic adaptability, capable of identifying high-quality trading opportunities in different market environments. However, users need to be vigilant about potential risks such as parameter sensitivity, false breakouts, and trend judgment errors, and can further enhance the strategy's stability and adaptability through multi-timeframe confirmation, market state classification, machine learning optimization, and other approaches.
With reasonable parameter settings and continuous optimization, this strategy can be a powerful weapon in a trader's toolkit, particularly suitable for finding market turning points where trading volume and price volatility anomalies coincide, helping traders capture key trading opportunities in complex and changing markets.
- 1