ATR Channel Squeeze Breakout Strategy: Volatility Breakout Trading System with Momentum Indicator

Overview
The ATR Channel Squeeze Breakout Strategy is a quantitative trading system designed to capture explosive breakout moves following low volatility consolidation periods. This strategy is based on a composite signal mechanism combining "volatility squeeze + channel breakout + momentum confirmation," which identifies high-probability buying opportunities by detecting market transition points from contraction to expansion. When the market is in a tight range and preparing for upward expansion, this strategy promptly captures breakout signals and establishes long positions, while employing a fixed-point stop-loss and take-profit mechanism to manage risk and profit.
Strategy Principles
The core principle of this strategy is based on volatility cycle theory, which suggests that market volatility alternates between high and low volatility periods. When volatility is unusually low, the market is often accumulating energy, preparing to break out in a certain direction. The specific operational logic of the strategy is as follows:
-
Volatility Squeeze Identification: Uses the ATR (Average True Range) indicator divided by closing price to calculate a normalized volatility indicator. When this indicator falls below a user-defined threshold, it identifies a "squeeze" state, indicating the market is in a low volatility phase.
-
Channel Breakout Confirmation: Calculates the highest high and lowest low over the past N periods to form a price channel. When the price breaks above the previous channel upper boundary (highest high), it triggers a breakout signal.
-
Momentum Filter: Uses the ROC (Rate of Change) indicator to confirm positive price momentum, ensuring the breakout direction aligns with the momentum trend, reducing false breakouts.
-
Entry Condition Combination: Only issues a buy signal when the previous period is in a squeeze state, the current period breaks above the channel upper boundary, and momentum is positive.
-
Risk Management: Adopts a fixed-point stop-loss and take-profit strategy, setting a fixed-point profit target above the entry price and a fixed-point stop-loss level below the entry price.
Key parts of the code demonstrate this logic:
- Normalized ATR calculation:
atrNorm = atr / close - Price channel calculation:
highestHigh = ta.highest(high, lengthChannel)andlowestLow = ta.lowest(low, lengthChannel) - Squeeze condition:
squeeze = atrNorm < squeezeThreshold - Breakout condition:
breakout = ta.crossover(close, highestHigh[1]) - Momentum condition:
momentumUp = roc > 0 - Final buy signal:
buySignal = squeeze[1] and breakout and momentumUp
Strategy Advantages
-
Accurate Capture of High-Probability Breakouts: The combination of volatility squeeze identification and momentum confirmation greatly increases the reliability of breakout signals, reducing losses from false breakouts.
-
Composite Signal Filtering: The strategy doesn't rely on a single indicator but comprehensively considers three dimensions: volatility, price breakout, and momentum, forming a multi-confirmation mechanism that improves signal quality.
-
Clear Risk Management: The fixed-point stop-loss and take-profit mechanism allows traders to precisely calculate risk-reward ratios before trading, facilitating fund management and position control.
-
Strong Adaptability: By adjusting parameters (ATR length, channel length, ROC length, squeeze threshold, take-profit/stop-loss points), the strategy can adapt to different market environments and instrument characteristics.
-
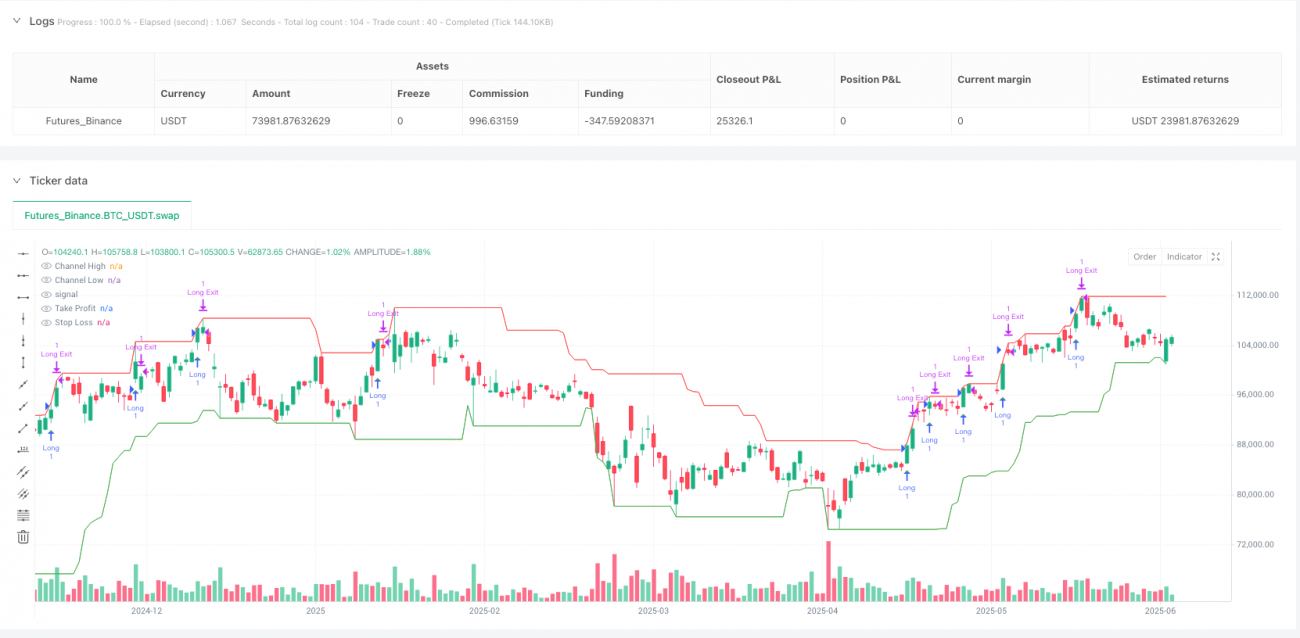
Visualization of Trading Signals: The strategy clearly marks buy signals, channel boundaries, and take-profit/stop-loss levels on the chart, allowing traders to intuitively understand market conditions and trading logic.
-
Suitable for Intraday and Short-Term Trading: The strategy is particularly suitable for finding explosive breakout opportunities from compression zones, perfectly matching the needs of intraday and short-term traders.
Strategy Risks
-
False Breakout Risk: Despite employing multiple filtering mechanisms, false breakouts may still occur, especially in situations with significant news interference. It is advisable to use this strategy cautiously before important economic data or news releases.
-
Insufficient Stop-Loss Risk: Fixed-point stop-losses may not adequately address actual market volatility, especially in high-volatility or gap-opening markets. Traders should dynamically adjust stop-loss points based on the characteristics of the trading instrument and current market environment.
-
Parameter Sensitivity: Strategy performance is sensitive to parameter selection, especially the squeeze threshold and channel length settings. Different market environments may require different parameter combinations, necessitating regular backtesting and optimization.
-
Market Environment Dependency: This strategy performs well in oscillating markets and trend transition periods but may trigger frequent signals in strong trending markets, leading to overtrading. Caution is needed in one-sided trending markets.
-
Point Setting Not Adapting to Market Volatility: Fixed-point take-profit and stop-loss settings do not consider changes in market volatility; stop-losses may be too small in high-volatility periods, and take-profits may be too large in low-volatility periods.
Strategy Optimization Directions
-
Dynamic Stop-Loss and Take-Profit Optimization: Replace fixed-point stop-loss and take-profit with ATR-based dynamic levels to better adapt risk management to current market volatility. For example, setting stop-loss at 1.5 times ATR and take-profit at 3 times ATR allows automatic adjustment as volatility changes.
-
Multi-Timeframe Confirmation: Introduce higher timeframe trend filtering conditions, only trading when the higher timeframe trend direction is consistent, reducing the risk of counter-trend trading.
-
Add Volume Confirmation: Incorporate volume confirmation conditions into breakout signals, only confirming valid breakouts when volume significantly increases, further reducing false breakouts.
-
Add Drawdown Management: Implement trailing stop-loss functionality to dynamically adjust stop-loss levels as prices move favorably, locking in partial profits and optimizing risk-reward ratios.
-
Intelligent Parameter Adaptation: Develop parameter self-adaptation mechanisms that automatically adjust strategy parameters based on recent market volatility characteristics, enabling the strategy to better adapt to different market phases.
-
Add Reverse Signals: Expand the strategy to capture downward breakout opportunities, allowing the strategy to profit in two-way markets and improving capital utilization efficiency.
-
Optimize Entry Timing: After confirming a breakout, wait for a small pullback before entering, or build positions in batches to obtain better entry prices and improve risk-reward ratios.
Summary
The ATR Channel Squeeze Breakout Strategy is a comprehensive trading system combining volatility, price breakout, and momentum analysis, capturing high-probability breakout trading opportunities by identifying market transition points from low to high volatility. This strategy is particularly suitable for intraday and short-term traders, effectively capturing explosive moves from consolidation ranges.
The core advantages of the strategy lie in its multi-signal confirmation mechanism and clear risk management framework, but it also faces challenges such as parameter sensitivity and market environment dependency. By implementing the suggested optimization measures, such as dynamic stop-loss and take-profit, multi-timeframe confirmation, and volume verification, the strategy's robustness and adaptability can be further enhanced.
For quantitative traders, this strategy provides a trading framework with solid theoretical foundations and clear logic, serving as a good starting point for building personalized trading systems. Most importantly, before applying it to live trading, sufficient historical backtesting and parameter optimization should be conducted, with appropriate adjustments made based on market experience and risk preferences.
- 1