
The Volatility-Adaptive Heikin Ashi ATR Trailing Stop Trend Trading Strategy is a systematic trading approach designed for trend identification and risk management in financial markets. The strategy is based on Heikin Ashi candlestick technique to filter market noise, combined with an Average True Range (ATR) dynamically adjusted trailing stop system, using Exponential Moving Average (EMA) crossovers to generate trading signals. The strategy executes long-only positions and enhances signal robustness and trade management through volatility-adjusted components. This strategy is particularly suitable for highly volatile markets such as cryptocurrencies, as well as for traders pursuing systematic trend following.
The core principles of this strategy rely on the synergistic action of several key technical components:
Heikin Ashi Candlestick Filtering: The strategy offers three different Heikin Ashi calculation modes (manual calculation, TradingView built-in function, and regular candlesticks) to mitigate short-term market noise and highlight underlying trend direction. The manual calculation mode provides the most transparent and reliable results, while the built-in function uses confirmed historical bars to prevent repainting.
ATR Trailing Stop Mechanism: Average True Range (ATR) serves as a dynamic measure of market volatility, combined with user-defined parameters (Key Value and ATR Period) to calibrate the trailing stop sensitivity, allowing it to adapt to different market volatility regimes. This mechanism aims to provide a dynamic exit point, preserving capital and locking in gains as a trend progresses.
EMA Crossover Signal Generation: Entry and exit signals are derived from the interaction between the Heikin Ashi price and an Exponential Moving Average (EMA). A crossover event between these two components is used to objectively identify momentum shifts, signaling potential long entry or exit points.
Rigorous Stop Loss Implementation: The strategy includes an optional stop loss feature, configurable as a percentage or fixed point deviation from the entry price. Importantly, stop loss execution is based on real market prices, not synthetic Heikin Ashi values, ensuring that risk management is grounded in actual market liquidity and price levels.
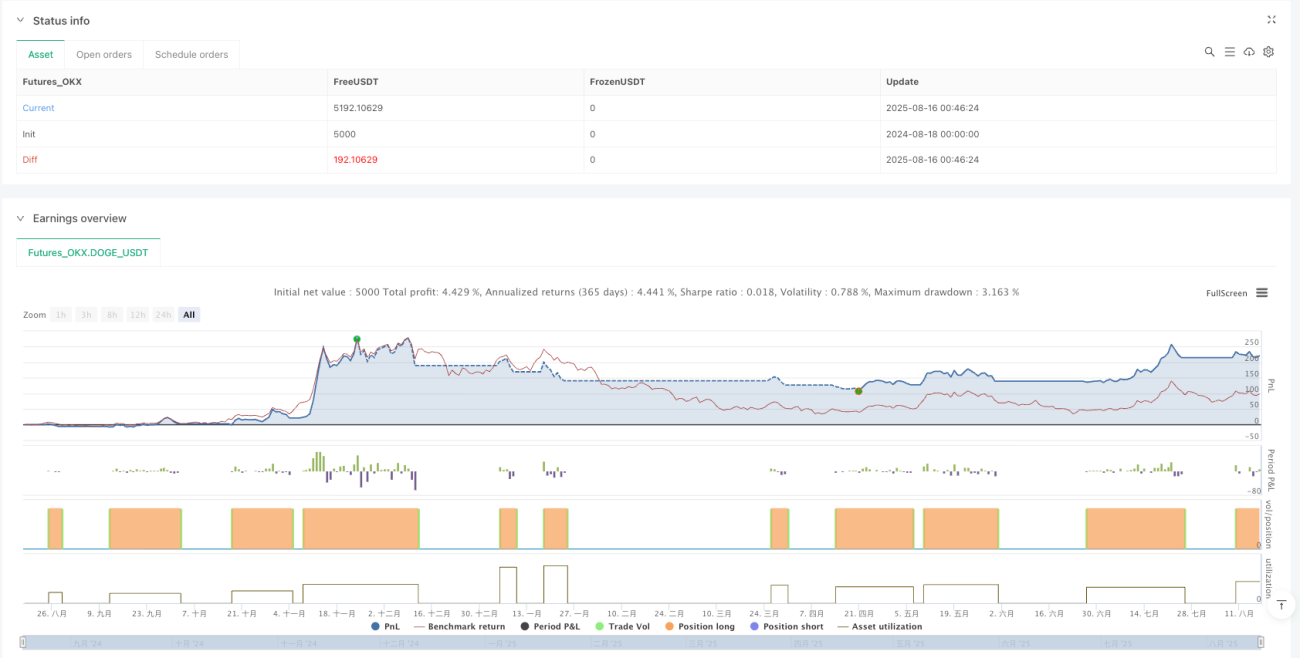
Backtesting Protocol: The strategy is configured for realistic backtesting, employing fill_orders_on_standard_ohlc=true to simulate order execution at standard OHLC prices, and includes a configurable Date Filter to define specific historical periods for performance evaluation.
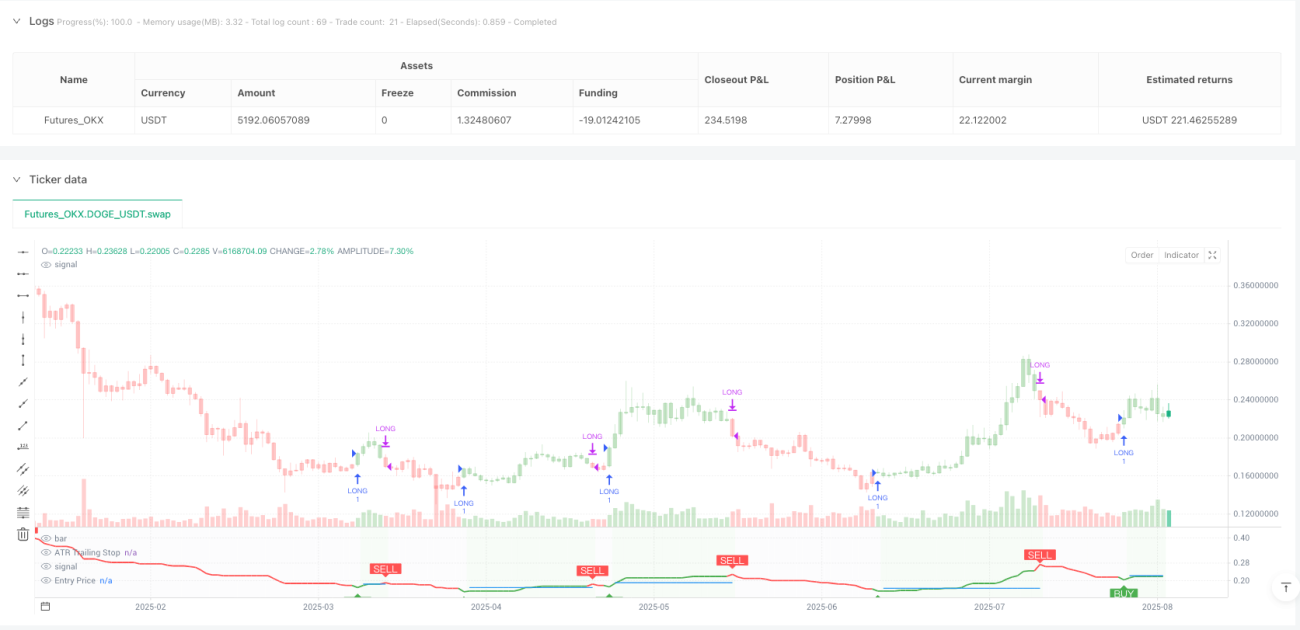
Data Visualization: The script provides on-chart visual overlays for buy/sell signals, the ATR trailing stop, and the stop loss level, as well as an integrated information table displaying real-time strategy parameters, current position status, trend direction, and key price levels.
Noise Filtering Capability: The Heikin Ashi candlestick technique effectively filters short-term market noise, helping traders focus on more significant market trends and reducing interference from false signals.
Dynamic Risk Management: The ATR-based trailing stop mechanism automatically adjusts according to market volatility, providing wider stops during increased volatility and tighter protection when volatility subsides, optimizing the risk-reward ratio.
Objective Entry and Exit Signals: Signals generated through EMA crossovers eliminate subjective judgment, making trading decisions more systematic and repeatable, contributing to emotional discipline.
Real Market Price Execution: The strategy uses real market prices (rather than Heikin Ashi synthetic prices) for trade execution and stop losses in backtesting, providing more accurate backtesting results that are closer to actual trading environments.
Visual Feedback and Monitoring: The integrated information table and visual indicators provide real-time strategy status and key data points, facilitating quick assessment and monitoring, enhancing decision-making capabilities.
Flexible Parameter Configuration: Adjustable key parameters (sensitivity value, ATR period, Heikin Ashi method, and stop loss settings) allow the strategy to adapt to different market environments and trader risk preferences.
Long-Only Strategy Design: Focusing on capturing upward trends avoids potential short squeeze risks, particularly suitable for markets with a long-term bullish bias, such as certain cryptocurrencies.
Trend Reversal Risk: As a trend-following strategy, it may face significant drawdowns during sideways markets or rapid reversals, and the ATR trailing stop may not fully prevent such losses.
Parameter Optimization Trap: Excessive optimization of parameters may lead to curve fitting, causing the strategy to perform excellently on historical data but poorly in future markets. Testing across multiple markets and timeframes is recommended to ensure robustness.
Entry Timing Risk: EMA crossover signals may occur at a relatively late stage of trend development, resulting in less-than-ideal entry positions. In strong markets, this may lead to buying at high levels.
Stop Loss Trigger Risk: In highly volatile markets, prices may briefly touch stop loss levels even during an overall favorable trend, causing unnecessary exits. Stop loss parameters need to be carefully set according to market characteristics.
Single Technical Indicator Dependency: The strategy primarily relies on ATR and EMA indicators without considering fundamental factors or other technical indicators, potentially missing important market turning points.
Performance in Extended Sideways Markets: In long-term sideways markets, the strategy may generate multiple false signals, resulting in accumulated small losses. It is advisable to use it when the market is confirmed to be in a trending state.
Slippage and Execution Risk: Although the strategy considers slippage in backtesting, actual slippage and execution delays in real trading may be greater than the set values, especially in less liquid markets.
Multi-Timeframe Analysis Integration: Consider integrating trend confirmation signals from higher timeframes, executing trades only when the trend direction on higher timeframes is consistent, which can significantly improve win rates and risk-reward ratios.
Volatility Filter: Adding a volatility-based filter to pause trading or adjust position sizes during abnormally high volatility periods can reduce risks associated with extreme market fluctuations.
Dynamic Position Management: Implementing dynamic position sizing based on volatility and market conditions, rather than fixed percentage allocations, can optimize capital efficiency across different market conditions.
Multi-Indicator Confirmation: Integrating other complementary technical indicators (such as Relative Strength Index RSI, Stochastic, or MACD) as secondary confirmations can reduce false signal rates and improve trade quality.
Stop Loss Strategy Improvement: Implementing more sophisticated stop loss strategies, such as multiples of ATR or support/resistance level-based stops, rather than simple percentages or fixed points, can better adapt to market structure.
Exit Strategy Refinement: Developing more refined partial profit-taking and staged exit mechanisms can lock in partial profits while maintaining trend exposure, optimizing the overall return curve.
Market Regime Recognition: Adding market regime recognition algorithms to automatically adjust strategy parameters for different market states (trending, oscillating, or reversing) enhances the strategyโs adaptive capabilities.
Machine Learning Integration: Exploring machine learning techniques to optimize parameter selection or predict optimal entry/exit points can further enhance strategy performance and reduce subjective intervention.
The Volatility-Adaptive Heikin Ashi ATR Trailing Stop Trend Trading Strategy is a well-designed, risk-controlled trend following system particularly suitable for markets with higher volatility. By combining the noise filtering capability of Heikin Ashi candlesticks, the dynamic risk management of ATR, and the trend identification functionality of EMA, the strategy provides an objective, systematic trading framework.
The strategyโs main strengths lie in its adaptability and dynamic risk management capability, automatically adjusting stop loss levels according to market volatility conditions, protecting capital and locking in profits. Meanwhile, its rigorous stop loss implementation and execution mechanism based on real market prices ensure the reliability and reproducibility of backtesting results.
However, as a trend-following strategy, it may face challenges during sideways markets or rapid reversals. Through integrating multi-timeframe analysis, adding volatility filters, optimizing position management, and refining exit strategies, the strategyโs robustness and performance can be further enhanced.
For traders looking to build systematic trading methods, this strategy provides a solid foundation that can be customized and expanded according to individual risk preferences and market characteristics, with the potential to achieve stable risk-adjusted returns across various market environments.
/*backtest
start: 2024-08-18 00:00:00
end: 2025-08-17 00:00:00
period: 1d
basePeriod: 1d
exchanges: [{"eid":"Futures_OKX","currency":"DOGE_USDT","balance":5000}]
*/
//@version=6
strategy(title="Mutanabby_AI | ATR+ | ") // Ensures realistic execution
// ๐ INPUT PARAMETERS
//=============================================================================
a = input.int(1, title="๐ง Key Value (Sensitivity)", minval=1, maxval=10,
tooltip="Lower = More signals, Higher = Fewer signals")
c = input.int(10, title="๐ ATR Period", minval=1, maxval=500,
tooltip="Period for ATR calculation")
// ๐ฏ๏ธ HEIKIN ASHI METHOD SELECTION
//=============================================================================
ha_method = input.string("Manual Calculation", title="๐ฏ๏ธ Heikin Ashi Method",
options=["Manual Calculation", "ticker.heikinashi()", "Regular Candles"],
tooltip="Manual = Most reliable, ticker.heikinashi = Good, Regular = Standard OHLC")
// ๐ก๏ธ STOP LOSS SETTINGS
//=============================================================================
use_stop_loss = input.bool(false, title="๐ก๏ธ Enable Stop Loss",
tooltip="Enable stop loss at entry price level")
stop_loss_type = input.string("Percentage", title="๐ Stop Loss Type",
options=["Percentage", "Fixed Points"],
tooltip="Choose stop loss calculation method")
stop_loss_percent = input.float(2.0, title="๐ Stop Loss %", minval=0.1, maxval=50.0, step=0.1,
tooltip="Stop loss percentage below entry price")
stop_loss_points = input.float(10.0, title="๐ Stop Loss Points", minval=0.1, step=0.1, tooltip="Stop loss in price points below entry price")
// Date condition
date_condition = true
// ๐จ VISUAL SETTINGS
//=============================================================================
show_signals = input.bool(true, title="๐ฏ Show Buy/Sell Signals")
show_trailing_stop = input.bool(true, title="๐ Show ATR Trailing Stop")
show_stop_loss = input.bool(true, title="๐ก๏ธ Show Stop Loss Line")
show_bar_colors = input.bool(true, title="๐จ Color Bars")
show_position_info = input.bool(true, title="๐ Show Position Info")
// ๐งฎ HEIKIN ASHI CALCULATIONS
//=============================================================================
// METHOD 1: MANUAL HEIKIN ASHI CALCULATION (MOST RELIABLE)
//=============================================================================
// Manual HA calculation - most transparent and reliable
var float ha_open_manual = na
ha_close_manual = (open + high + low + close) / 4
ha_open_manual := na(ha_open_manual[1]) ? (open + close) / 2 : (ha_open_manual[1] + ha_close_manual[1]) / 2
ha_high_manual = math.max(high, math.max(ha_open_manual, ha_close_manual))
ha_low_manual = math.min(low, math.min(ha_open_manual, ha_close_manual))
// METHOD 2: TICKER.HEIKINASHI() (GOOD ALTERNATIVE)
//=============================================================================
// Get Heikin Ashi data via ticker.heikinashi() - non-repainting
ha_ticker = ticker.heikinashi(syminfo.tickerid)
[ha_open_ticker, ha_high_ticker, ha_low_ticker, ha_close_ticker] = request.security(ha_ticker, timeframe.period, [open[1], high[1], low[1], close[1]], lookahead=barmerge.lookahead_on) // Use confirmed bars to prevent repainting
// METHOD 3: REGULAR CANDLES
//=============================================================================
// Regular OHLC data
ha_open_regular = open
ha_high_regular = high
ha_low_regular = low
ha_close_regular = close
// SELECT METHOD BASED ON USER INPUT
//=============================================================================
src = ha_method == "Manual Calculation" ? ha_close_manual :
ha_method == "ticker.heikinashi()" ? ha_close_ticker : ha_close_regular
source_open = ha_method == "Manual Calculation" ? ha_open_manual :
ha_method == "ticker.heikinashi()" ? ha_open_ticker : ha_open_regular
source_high = ha_method == "Manual Calculation" ? ha_high_manual :
ha_method == "ticker.heikinashi()" ? ha_high_ticker : ha_high_regular
source_low = ha_method == "Manual Calculation" ? ha_low_manual :
ha_method == "ticker.heikinashi()" ? ha_low_ticker : ha_low_regular
// ๐ ATR TRAILING STOP CALCULATION
//=============================================================================
// Calculate True Range using selected method
tr1 = source_high - source_low
tr2 = math.abs(source_high - src[1])
tr3 = math.abs(source_low - src[1])
tr = math.max(tr1, math.max(tr2, tr3))
// ATR calculation
xATR = ta.sma(tr, c)
nLoss = a * xATR
// ATR Trailing Stop logic
var float xATRTrailingStop = na
xATRTrailingStop := if src > nz(xATRTrailingStop[1], 0) and src[1] > nz(xATRTrailingStop[1], 0)
math.max(nz(xATRTrailingStop[1]), src - nLoss)
else if src < nz(xATRTrailingStop[1], 0) and src[1] < nz(xATRTrailingStop[1], 0)
math.min(nz(xATRTrailingStop[1]), src + nLoss)
else if src > nz(xATRTrailingStop[1], 0)
src - nLoss
else
src + nLoss
// Position state tracking
var int pos = na
pos := if src[1] < nz(xATRTrailingStop[1], 0) and src > nz(xATRTrailingStop[1], 0)
1
else if src[1] > nz(xATRTrailingStop[1], 0) and src < nz(xATRTrailingStop[1], 0)
-1
else
nz(pos[1], 0)
// ๐ฏ SIGNAL GENERATION
//=============================================================================
// EMA for crossover detection
ema_val = ta.ema(src, 1)
// Crossover conditions
above = ta.crossover(ema_val, xATRTrailingStop)
below = ta.crossover(xATRTrailingStop, ema_val)
// Buy and sell signals
buy_signal = src > xATRTrailingStop and above
sell_signal = src < xATRTrailingStop and below
// Trend direction
is_uptrend = src > xATRTrailingStop
is_downtrend = src < xATRTrailingStop
// ๐ก๏ธ STOP LOSS CALCULATION
//=============================================================================
var float entry_price = na
var float stop_loss_level = na
// Calculate stop loss level
calculate_stop_loss(entry_price_val) =>
if stop_loss_type == "Percentage"
entry_price_val * (1 - stop_loss_percent / 100)
else
entry_price_val - stop_loss_points
// ๐ LONG ONLY STRATEGY LOGIC
//=============================================================================
var bool in_long_position = false
// Entry condition: Buy signal when not in position
long_entry = buy_signal and date_condition and not in_long_position
// Exit conditions - CRITICAL: Use real prices for stop loss, not HA prices
atr_exit = sell_signal and date_condition and in_long_position
stop_loss_hit = use_stop_loss and in_long_position and low <= stop_loss_level // Uses real low price
// Combined exit condition
long_exit = atr_exit or stop_loss_hit
// Execute trades - Orders execute at REAL market prices
if long_entry
strategy.entry("LONG", strategy.long, comment="๐ LONG")
in_long_position := true
entry_price := close // REAL entry price, not HA price
stop_loss_level := use_stop_loss ? calculate_stop_loss(entry_price) : na
if long_exit
exit_reason = stop_loss_hit ? "๐ก๏ธ STOP LOSS" : "๐ฐ ATR EXIT"
strategy.close("LONG", comment=exit_reason)
in_long_position := false
entry_price := na
stop_loss_level := na
// ๐จ VISUAL ELEMENTS
//=============================================================================
// Trailing stop line color
stop_color = pos == 1 ? color.green : pos == -1 ? color.red : color.blue
// Plot ATR Trailing Stop
plot(show_trailing_stop ? xATRTrailingStop : na,
color=stop_color,
linewidth=2,
title="ATR Trailing Stop")
// Plot Stop Loss Level
plot(show_stop_loss and use_stop_loss and in_long_position ? stop_loss_level : na,
color=color.new(color.red, 0),
linewidth=2,
style=plot.style_linebr,
title="Stop Loss Level")
// Plot buy/sell signals
plotshape(show_signals and buy_signal,
title="Buy Signal",
text="BUY",
style=shape.labelup,
location=location.belowbar,
color=color.new(color.green, 0),
textcolor=color.white,
size=size.small)
plotshape(show_signals and sell_signal,
title="Sell Signal",
text="SELL",
style=shape.labeldown,
location=location.abovebar,
color=color.new(color.red, 0),
textcolor=color.white,
size=size.small)
// Plot stop loss hit signal
plotshape(show_signals and stop_loss_hit,
title="Stop Loss Hit",
text="SL",
style=shape.labeldown,
location=location.abovebar,
color=color.new(color.orange, 0),
textcolor=color.white,
size=size.small)
// Bar coloring
barcolor(show_bar_colors ? (is_uptrend ? color.new(color.green, 70) :
is_downtrend ? color.new(color.red, 70) : na) : na)
// Position status background
bgcolor(show_position_info and strategy.position_size > 0 ? color.new(color.green, 95) : show_position_info and strategy.position_size == 0 ? color.new(color.gray, 98) : na, title="Position Status")
// Entry price line - shows REAL entry price
plot(show_position_info and strategy.position_size > 0 ? strategy.position_avg_price : na,
color=color.new(color.blue, 0),
linewidth=1,
style=plot.style_linebr,
title="Entry Price")
// ๐ INFORMATION TABLE
//=============================================================================
if show_position_info and barstate.islast
var table info_table = table.new(position.top_right, 3, 11,
bgcolor=color.white,
border_width=1,
border_color=color.gray,
frame_width=1,
frame_color=color.black)
// Table headers
table.cell(info_table, 0, 0, "Mutanabby_AI | Manual HA | ATR | SL", text_color=color.white, bgcolor=color.blue, text_size=size.small)
table.cell(info_table, 1, 0, "", text_color=color.white, bgcolor=color.blue)
table.cell(info_table, 2, 0, "", text_color=color.white, bgcolor=color.blue)
// Strategy info
table.cell(info_table, 0, 1, "HA Method:", text_color=color.rgb(10, 10, 10), text_size=size.small)
method_color = ha_method == "Manual Calculation" ? color.green :
ha_method == "ticker.heikinashi()" ? color.blue : color.gray
table.cell(info_table, 1, 1, ha_method, text_color=method_color, text_size=size.small)
table.cell(info_table, 0, 2, "Key Value:", text_color=color.rgb(10, 10, 10), text_size=size.small)
table.cell(info_table, 1, 2, str.tostring(a), text_color=color.blue, text_size=size.small)
table.cell(info_table, 0, 3, "ATR Period:", text_color=color.rgb(2, 2, 2), text_size=size.small)
table.cell(info_table, 1, 3, str.tostring(c), text_color=color.blue, text_size=size.small)
table.cell(info_table, 0, 4, "Stop Loss:", text_color=color.rgb(3, 3, 3), text_size=size.small)
table.cell(info_table, 1, 4, use_stop_loss ? "ON" : "OFF",
text_color=use_stop_loss ? color.green : color.gray, text_size=size.small)
table.cell(info_table, 0, 5, "Position:", text_color=color.rgb(3, 3, 3), text_size=size.small)
table.cell(info_table, 1, 5, strategy.position_size > 0 ? "LONG" : "NONE",
text_color=strategy.position_size > 0 ? color.green : color.gray, text_size=size.small)
table.cell(info_table, 0, 6, "Trend:", text_color=color.rgb(0, 0, 0), text_size=size.small)
table.cell(info_table, 1, 6, is_uptrend ? "UP" : "DOWN",
text_color=is_uptrend ? color.green : color.red, text_size=size.small)
table.cell(info_table, 0, 7, "Current Price:", text_color=color.black, text_size=size.small)
table.cell(info_table, 1, 7, str.tostring(close, "#.##"), text_color=color.black, text_size=size.small)
table.cell(info_table, 0, 8, "Trailing Stop:", text_color=color.black, text_size=size.small)
table.cell(info_table, 1, 8, str.tostring(xATRTrailingStop, "#.##"), text_color=color.blue, text_size=size.small)
// Show stop loss level if enabled and in position
if use_stop_loss and in_long_position
table.cell(info_table, 0, 9, "Stop Loss:", text_color=color.black, text_size=size.small)
table.cell(info_table, 1, 9, str.tostring(stop_loss_level, "#.##"), text_color=color.red, text_size=size.small)
else
table.cell(info_table, 0, 9, "Stop Loss:", text_color=color.black, text_size=size.small)
table.cell(info_table, 1, 9, "N/A", text_color=color.gray, text_size=size.small)
table.cell(info_table, 0, 10, "Last Signal:", text_color=color.black, text_size=size.small)
signal_text = buy_signal ? "BUY" : sell_signal ? "SELL" : stop_loss_hit ? "STOP LOSS" : "NONE"
signal_color = buy_signal ? color.green : sell_signal ? color.red : stop_loss_hit ? color.orange : color.gray
table.cell(info_table, 1, 10, signal_text, text_color=signal_color, text_size=size.small)
// ๐จ ALERTS
//=============================================================================
// Alert conditions
alertcondition(buy_signal, title="๐ Mutanabby_AI | ATR+ LONG Entry",
message="Mutanabby_AI | ATR+ : BUY signal at {{close}}")
alertcondition(sell_signal, title="๐ฐ Mutanabby_AI | ATR+ LONG Exit",
message="Mutanabby_AI | ATR+ : SELL signal at {{close}}")
alertcondition(stop_loss_hit, title="๐ก๏ธ Mutanabby_AI | ATR+ Stop Loss Hit",
message="Mutanabby_AI | ATR+ : STOP LOSS hit at {{close}}")
alertcondition(buy_signal or sell_signal or stop_loss_hit, title="๐ Mutanabby_AI | ATR+ Any Signal",
message="Mutanabby_AI| ATR+ : {{ticker}} - {{close}} - Signal: {{strategy.position_size > 0 ? 'EXIT' : 'ENTRY'}}")
//=============================================================================
// ๐ STRATEGY NOTES:
//
// ๐ฏ OPTIMAL IMPLEMENTATION for realistic backtesting:
// ๐ Uses manual HA calculation for transparency and reliability
// ๐ฐ Orders execute at REAL market prices (not synthetic HA prices)
// ๐ก๏ธ Stop loss uses real market prices for accurate risk management
// ๐ง Multiple HA methods available for comparison and validation
// โก Added fill_orders_on_standard_ohlc=true for extra protection
//
// ๐ฏ METHOD COMPARISON:
// ๐ฅ Manual Calculation: Most reliable, transparent, no external dependencies
// ๐ฅ ticker.heikinashi(): Good alternative, uses confirmed bars to prevent repainting
// ๐ฅ Regular Candles: Standard OHLC for comparison purposes
//
// ๐ก BEST PRACTICES IMPLEMENTED:
// โ
Always run on regular candlestick charts (not native HA charts)
// โ
Use confirmed/historical HA values to prevent repainting
// โ
Execute all orders at real market prices
// โ
Stop loss based on real prices, not synthetic HA prices
// โ
Entry price tracking uses actual fill prices
// โ
Transparent calculation methods for verification
//
// ๐จ AVOID:
// โ Running strategies directly on TradingView's native HA charts
// โ Using current bar HA values (causes repainting)
// โ Stop loss based on HA prices instead of real prices
//=============================================================================