Estrategias precisas de trading cuantitativo en posiciones largas y cortas


Fecha de creación: 2023-12-07 16:19:11 Última modificación: 2023-12-07 16:19:11
Copiar: 0 Número de Visitas: 938
1
Seguir
1619
Seguidores

Estrategias precisas de trading cuantitativo en posiciones largas y cortas

Descripción general

Este artículo presenta principalmente una estrategia de comercio cuantitativa basada en el canal de Brin, el indicador ADX en combinación con la línea K para el juicio de la carencia. Esta estrategia utiliza el canal de Brin para determinar la tendencia y la volatilidad del mercado, y en combinación con el indicador ADX para determinar la fortaleza de la tendencia del mercado.

Principio de estrategia

    1. La dirección de la tendencia del mercado se determina en función de la trayectoria ascendente y descendente del canal de Brin. Los precios están por encima de la trayectoria ascendente como trayectoria alcista y por debajo de la trayectoria descendente como trayectoria alcista.
    1. El ancho de banda del canal de Brin refleja la volatilidad y el riesgo del mercado. El ancho de banda del canal de Brin indica que cuanto más se agita el mercado, mayor es el riesgo, y se debe evitar la creación de posiciones.
    1. El indicador ADX determina que la tendencia del mercado es fuerte o débil. Cuando el valor de ADX es mayor que 25 indica una tendencia, y en este caso se determina la dirección de la entrada de Boolean para elegir la dirección de la posición. Cuando el ADX es menor que 25 indica una tendencia de movimiento, y en este caso se debe evitar el comercio.
    1. Después de la decisión de hacer más de la dirección de corto plazo, se establece el nivel de pérdida de acuerdo con el indicador ATR. El ATR se utiliza para medir la amplitud de la fluctuación del mercado, se establece la distancia de pérdida de acuerdo con el múltiplo de ATR.
    1. El tope se puede ajustar de acuerdo con el puente para subir y bajar de la vía. El tope de más cabeza para bajar de la vía, el tope de cabeza vacía para subir de la vía. O el tope fijo se puede ajustar de acuerdo con el múltiplo de ATR del indicador ATR.
    1. La gestión de pérdidas y ganancias entre los puntos de parada y los puntos de parada, la configuración de un stop loss móvil para bloquear las ganancias.

Ventajas estratégicas

  1. La combinación de la dirección de juicio del canal de Brin y el indicador ADX permite determinar con claridad el exceso de espacio y la construcción de posiciones selectivas, evitando transacciones inútiles en situaciones de crisis.

  2. Utiliza el ancho de banda de Brin para evaluar el riesgo de volatilidad. El ancho de banda de Brin es más probable que se estreche, pero el riesgo es menor. Evita el comercio cuando el ancho de banda de Brin se amplía.

  3. La configuración de ATR para evitar pérdidas permite controlar el riesgo y evitar al máximo que las pérdidas sean perseguidas.

  4. Según la configuración de la posición de parada en el canal de Brin, no hay riesgo de que la parada de seguimiento suba y la parada de seguimiento baje.

  5. Las paradas móviles se ejecutan en el momento de la parada posterior a la ganancia para asegurar la ganancia y seguir la tendencia.

Riesgo estratégico

  1. El canal de Brin y el indicador ADX pueden estar sometidos a presión. Si se produce una desviación, puede ocasionar un error de juicio.

  2. El indicador ATR sólo refleja la fluctuación histórica y no puede predecir la fluctuación futura.

  3. La división territorial del Canal de Brin es subjetiva, y es posible que se pierda una oportunidad.

  4. El movimiento de pérdidas se puede realizar solo en el disco, con el riesgo de no poder moverse durante un período de tiempo intermedio.

  5. El riesgo de que los datos de retroalimentación se ajusten. Los informes de prueba son difíciles de reproducir en el mercado real.

Optimización de la estrategia

  1. La integración de más indicadores de confianza para evitar falsas señales en el canal de Brin y el indicador ADX.

  2. El parón ATR se puede agregar al parón de salto en altura. O el parón de parón se puede usar para predecir la configuración de la volatilidad del mercado utilizando algoritmos de aprendizaje profundo.

  3. Optimizar los parámetros del canal de Brin para que pueda abrazar una mayor oportunidad de mercado.

  4. El uso de un sistema de negociación programada más eficiente para el deterioro móvil de la guardia no tripulada.

  5. Las revisiones se realizan en períodos de tiempo más largos y con más combinaciones de variedades para asegurar la solidez de la estrategia.

Resumir

Esta estrategia integra señales de indicadores múltiples como el canal de Brin, el indicador ADX, la construcción de posiciones selectivas después de determinar la dirección de la tendencia clara y la optimización de la configuración de stop loss con el indicador ATR para controlar al máximo el riesgo y la rentabilidad, es una estrategia de comercio cuantitativa recomendable. Vemos que hay mucho espacio para optimizar esta estrategia y esperamos la salida de futuras versiones de la generación.
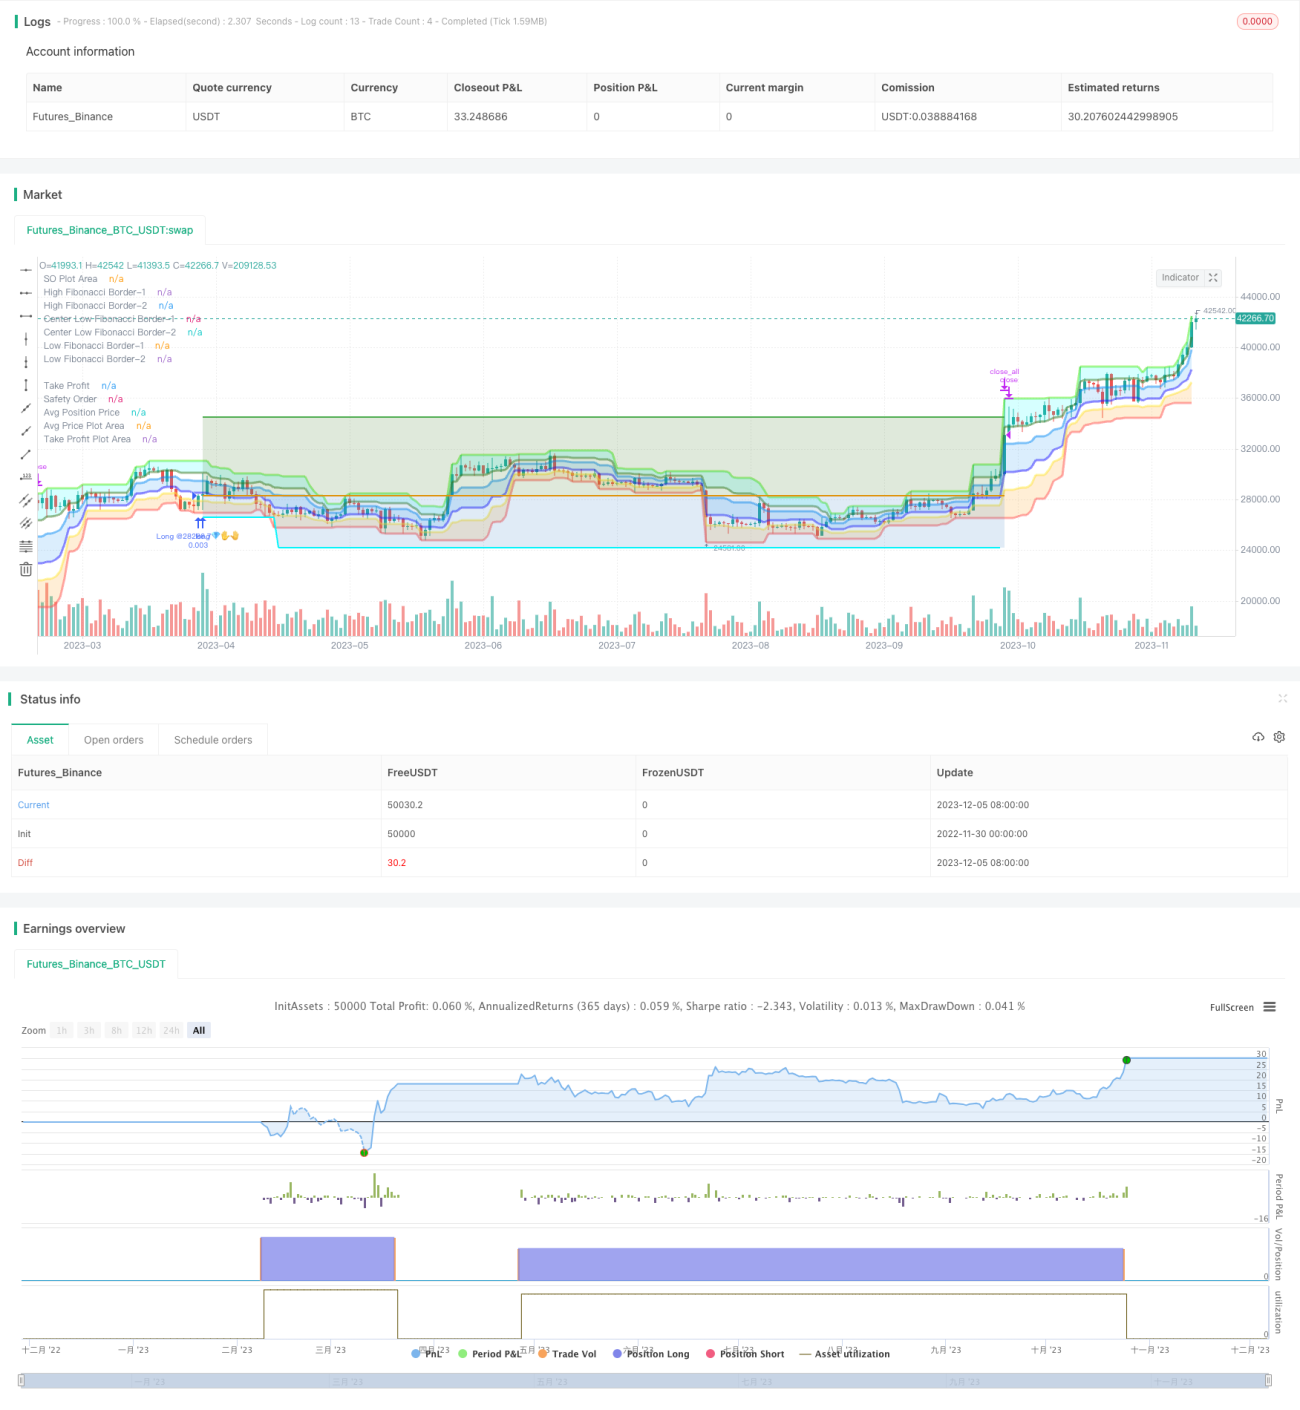
Código Fuente de la Estrategia
/*backtest
start: 2022-11-30 00:00:00
end: 2023-12-06 00:00:00
period: 1d
basePeriod: 1h
exchanges: [{"eid":"Futures_Binance","currency":"BTC_USDT"}]
*/

// © Fibonacci Zone DCA Strategy - R3c0nTrader ver 2022-06-12
// For backtesting with 3Commas DCA Bot settings
// Thank you "eykpunter" for granting me permission to use "Fibonacci Zones" to create this strategy
// Thank you "junyou0424" for granting me permission to use "DCA Bot with SuperTrend Emulator" which I used for adding bot inputs, calculations, and strategy
//@version=5
strategy('Fibonacci Zone DCA Strategy - R3c0nTrader', shorttitle='Fibonacci Zone DCA Strategy', overlay=true )

// Strategy Inputs
// Start and End Dates
i_startTime = input(defval=timestamp('01 Jan 2015 00:00 +0000'), title='Start Time', group="Date Range")
i_endTime = input(defval=timestamp('31 Dec 2050 23:59 +0000'), title='End Time', group="Date Range")
inDateRange = true

// Fibonacci Settings
sourceInput = input.source(close, "Source", group="Trade Entry Settings")
per = input(14, title='Fibonacci length', tooltip='Number of bars to look back. Recommended for beginners to set ADX Smoothing and DI Length to the same value as this.', group="Trade Entry Settings")
hl = ta.highest(high, per)  //High Line (Border)
ll = ta.lowest(low, per)  //Low Line  (Border)
dist = hl - ll  //range of the channel    
hf = hl - dist * 0.236  //Highest Fibonacci line
cfh = hl - dist * 0.382  //Center High Fibonacci line
cfl = hl - dist * 0.618  //Center Low Fibonacci line
lf = hl - dist * 0.764  //Lowest Fibonacci line

// ADX Settings
lensig = input.int(14, title="ADX Smoothing", tooltip='Fibonacci signals work best when market is trending. ADX is used to measure trend strength. Default value is 14. Recommend for beginners to match this with Fibonacci length and DI Length',minval=1, maxval=50, group="Trade Entry Settings")
len = input.int(14, minval=1, title="DI Length", tooltip='Fibonacci signals work best when market is trending. DI Length is used to calculate ADX to measure trend strength. Default value is 14. Recommend for beginners to match this with Fibonacci length and ADX Smoothing.', group="Trade Entry Settings")
adx_min = input.int(25, title='Min ADX value to open trade', tooltip='Use this to set the minium ADX value (trend strength) to open trade. 25 or higher is recommended for beginners. 0 to 20 is a weak trend. 25 to 35 is a strong trend. 35 to 45 is a very strong trend. 45 to 100 is an extremely strong trend.', group="Trade Entry Settings")
up = ta.change(high)
down = -ta.change(low)
plusDM = na(up) ? na : (up > down and up > 0 ? up : 0)
minusDM = na(down) ? na : (down > up and down > 0 ? down : 0)
trur = ta.rma(ta.tr, len)
di_plus = fixnan(100 * ta.rma(plusDM, len) / trur)
di_minus = fixnan(100 * ta.rma(minusDM, len) / trur)
sum = di_plus + di_minus
adx = 100 * ta.rma(math.abs(di_plus - di_minus) / (sum == 0 ? 1 : sum), lensig)
fib_choice = input.string("2-Higher than the top of the Downtrend Fib zone", title="Open a trade when the price moves:", options=["1-To the bottom of Downtrend Fib zone", "2-Higher than the top of the Downtrend Fib zone", "3-Higher than the bottom of Ranging Fib Zone", "4-Higher than the top of Ranging Fib Zone", "5-Higher than the bottom of Uptrend Fib Zone", "6-To the top of Uptrend Fib Zone"],
   tooltip='There are three fib zones. The options are listed from the bottom zone to the top zone. The bottom zone is the Downtrend zone; the middle zone is the Ranging zone; The top fib zone is the Uptrend zone;',
   group="Trade Entry Settings")
di_choice = input.bool(false, title="Only open trades on bullish +DI (Positive Directional Index)? (off for contrarian traders)", tooltip=
   'Default is disabled. If you want to be more selective (you want a bullish confirmation), enable this and it will only open trades when the +DI (Positive Directional Index) is higher than the -DI (Negative Directional Index). Contrarian traders (buy the dip) should leave this disabled', 
   group="Trade Entry Settings")
di_min = input.int(0, title='Min +DI value to open trade', 
   tooltip='Default is zero. Use this to set the minium +DI value to open the trade. Try incrementing this value if you want to be more selective and filter for more bullish moves (e.g. 20-25). For Contrarian traders, uncheck "Only open trades on bullish DI" option and set Min +DI to zero', 
   group="Trade Entry Settings")
di_max = input.int(100, title='Max +DI value to open trade', tooltip='Default is 100. Use this to set the maxium +DI value to open trade. For Contrarian traders, uncheck "Only open trades on bullish DI" option and try a Max +DI value no higher than 20 or 25', group="Trade Entry Settings")
di_inrange = di_plus >= di_min and di_plus <= di_max

// Truncate function
truncate(number, decimals) =>
    factor = math.pow(10, decimals)
    int(number * factor) / factor

//Declare take_profit
take_profit = float(0.22)

// Take Profit Drop-down menu option
tp_choice = input.string("Target Take Profit (%)", title="Take profit using:", options=["Target Take Profit (%)", "High Fibonacci Border-1", "High Fibonacci Border-2"], tooltip=
   'Select how to exit your trade and take profit. Then specify below this option the condition to exit. "High Fibonacci Border-1" is the top-most Fibonacci line in the green uptrend zone. "High Fibonacci Border-2" is the bottom Fibonacci line in the green uptrend zone. You can find these lines on the "Style" tab and toggle them off/on to locate these lines for more clarity', 
   group="Trade Exit Settings")
if tp_choice == "Target Take Profit (%)"
    take_profit := input.float(22.0, title='Target Take Profit (%)', step=0.5, minval=0.0, tooltip='Only used if "Target Take Profit (%)" is selected above.', group="Trade Exit Settings") / 100
    take_profit
else if tp_choice == "High Fibonacci Border-1"
    take_profit := float(hl)
    take_profit
else if tp_choice == "High Fibonacci Border-2"
    take_profit := float(hf)
    take_profit

trailing = input.float(0.0, title='Trailing deviation. Default= 0.0 (%)', step=0.5, minval=0.0, group="Trade Exit Settings") / 100
base_order = input(100.0, title='Base order', group="Trade Entry Settings")
safe_order = input(200.0, title='Safety order', group="Trade Entry Settings")
price_deviation = input.float(6.0, title='Price deviation to open safety orders (%)', step=0.25, minval=0.0, group="Trade Entry Settings") / 100
safe_order_volume_scale = input.float(2.0, step=0.5, title='Safety order volume scale', group="Trade Entry Settings")
safe_order_step_scale = input.float(1.4, step=0.1, title='Safety order step scale', group="Trade Entry Settings")
max_safe_order = input(5, title='Max safety orders', group="Trade Entry Settings")

var current_so = 0
var initial_order = 0.0
var previous_high_value = 0.0
var original_ttp_value = 0.0

// Calculate our key levels
take_profit_level = strategy.position_avg_price * (1 + take_profit)

if tp_choice == "Target Take Profit (%)"
    take_profit_level := strategy.position_avg_price * (1 + take_profit)
else
    take_profit_level := take_profit

fib_trigger = bool(false)
if fib_choice == "2-Higher than the top of the Downtrend Fib zone"
    fib_trigger := ta.crossover(sourceInput, lf)
else if fib_choice == "1-To the bottom of Downtrend Fib zone"
    fib_trigger := sourceInput <= ll
else if fib_choice == "3-Higher than the bottom of Ranging Fib Zone"
    fib_trigger := ta.crossover(sourceInput, cfl)
else if fib_choice == "4-Higher than the top of Ranging Fib Zone"
    fib_trigger := ta.crossover(sourceInput, cfh)
else if fib_choice == "5-Higher than the bottom of Uptrend Fib Zone"
    fib_trigger := ta.crossover(sourceInput, hf)
else if fib_choice == "6-To the top of Uptrend Fib Zone"
    fib_trigger := sourceInput >= hl


// If option enabled for enter trades only when DI is positive, then open trade based on user settings
if di_choice == true and strategy.position_size == 0 and sourceInput > 0 and inDateRange and fib_trigger and adx >= adx_min and di_plus > di_minus and di_inrange
    strategy.entry('Long @' + str.tostring(sourceInput)+'💎✋🤚', strategy.long, qty=base_order / sourceInput)
    initial_order := sourceInput
    current_so := 1
    previous_high_value := 0.0
    fib_trigger := false
    original_ttp_value := 0
    original_ttp_value
    
// Open First Position when candle source value crosses above the 'Low Fibonacci Border-1'
else if di_choice == false and strategy.position_size == 0 and sourceInput > 0 and inDateRange and fib_trigger and adx >= adx_min and di_inrange
    strategy.entry('Long @' + str.tostring(sourceInput)+'💎✋🤚', strategy.long, qty=base_order / sourceInput)
    initial_order := sourceInput
    current_so := 1
    previous_high_value := 0.0
    fib_trigger := false
    original_ttp_value := 0
    original_ttp_value
    
threshold = 0.0
    
if safe_order_step_scale == 1.0
    threshold := initial_order - initial_order * price_deviation * safe_order_step_scale * current_so
    threshold

else if current_so <= max_safe_order
    threshold := initial_order - initial_order * ((price_deviation * math.pow(safe_order_step_scale, current_so) - price_deviation) / (safe_order_step_scale - 1))
    threshold

else if current_so > max_safe_order
    threshold := initial_order - initial_order * ((price_deviation * math.pow(safe_order_step_scale, max_safe_order) - price_deviation) / (safe_order_step_scale - 1))
    threshold
    
// Average down when lowest candle value crosses below threshold
if current_so > 0 and low <= threshold and current_so <= max_safe_order and previous_high_value == 0.0
    // Trigger a safety order at the Safety Order "threshold" price
    strategy.entry('😨🙏 SO ' + str.tostring(current_so) + '@' + str.tostring(threshold), direction=strategy.long, qty=safe_order * math.pow(safe_order_volume_scale, current_so - 1) / threshold)
    current_so += 1
    current_so

// Take Profit!
// Take profit when take profit level is equal to or higher than the high of the candle
if take_profit_level <= high and strategy.position_size > 0 or previous_high_value > 0.0
    if trailing > 0.0
        if previous_high_value > 0.0
            if high >= previous_high_value
                previous_high_value := sourceInput
                previous_high_value
            else
                previous_high_percent = (previous_high_value - original_ttp_value) * 1.0 / original_ttp_value
                current_high_percent = (high - original_ttp_value) * 1.0 / original_ttp_value
                if previous_high_percent - current_high_percent >= trailing
                    strategy.close_all(comment='Close (trailing) @' + str.tostring(truncate(current_high_percent * 100, 3)) + '%')
                    current_so := 0
                    previous_high_value := 0
                    original_ttp_value := 0
                    original_ttp_value
        else
            previous_high_value := high
            original_ttp_value := high
            original_ttp_value
    else
        strategy.close_all(comment='💰 Close @' + str.tostring(high))
        current_so := 0
        previous_high_value := 0
        original_ttp_value := 0
        original_ttp_value

// Plot Fibonacci Areas
fill(plot(hl, title='High Fibonacci Border-1', color=color.new(#53ed0f, 50), linewidth=3), plot(hf, title='High Fibonacci Border-2', color=color.new(#38761d, 50), linewidth=3), color=color.new(#00FFFF, 80), title='Uptrend Fibonacci Zone @ 23.6%')  //uptrend zone
fill(plot(cfh, title='Center Low Fibonacci Border-1', color=color.new(#0589f4, 50), linewidth=3), plot(cfl, title='Center Low Fibonacci Border-2', color=color.new(#2018ff, 50), linewidth=3), color=color.new(color.blue, 80), title='Ranging Fibonacci Zone @ 61.8%')  // ranging zone
fill(plot(lf, title='Low Fibonacci Border-1', color=color.new(color.yellow, 50), linewidth=3), plot(ll, title='Low Fibonacci Border-2', color=color.new(color.red, 50), linewidth=3), color=color.new(color.orange, 80), title='Downtrend Fibonacci Zone @ 76.4%')  //down trend zone

// Plot TP
plot(strategy.position_size > 0 ? take_profit_level : na, style=plot.style_linebr, color=color.green, linewidth=2, title="Take Profit")

// Plot All Safety Order lines except for last one as bright blue
plot(strategy.position_size > 0 and current_so <= max_safe_order and current_so > 0 ? threshold : na, style=plot.style_linebr, color=color.new(#00ffff,0), linewidth=2, title="Safety Order")

// Plot Last Safety Order Line as Red
plot(strategy.position_size > 0 and current_so > max_safe_order ? threshold : na, style=plot.style_linebr, color=color.red, linewidth=2, title="No Safety Orders Left")

// Plot Average Position Price Line as Orange
plot(strategy.position_size > 0 ? strategy.position_avg_price : na, style=plot.style_linebr, color=color.orange, linewidth=2, title="Avg Position Price")

// Fill TP Area and SO Area
h1 = plot(strategy.position_avg_price, color=color.new(#000000,100), title="Avg Price Plot Area", display=display.none, editable=false)
h2 = plot(take_profit_level, color=color.new(#000000,100), title="Take Profit Plot Area", display=display.none, editable=false)
h3 = plot(threshold, color=color.new(#000000,100), title="SO Plot Area", display=display.none, editable=false)

// Fill TP Area and SO Area
fill(h1,h2,color=color.new(#38761d,80), title="Take Profit Plot Area")
// Current SO Area
fill(h1,h3,color=color.new(#3d85c6,80), title="SO Plot Area")