Estrategia de ruptura de media móvil de triple supertendencia
Descripción general
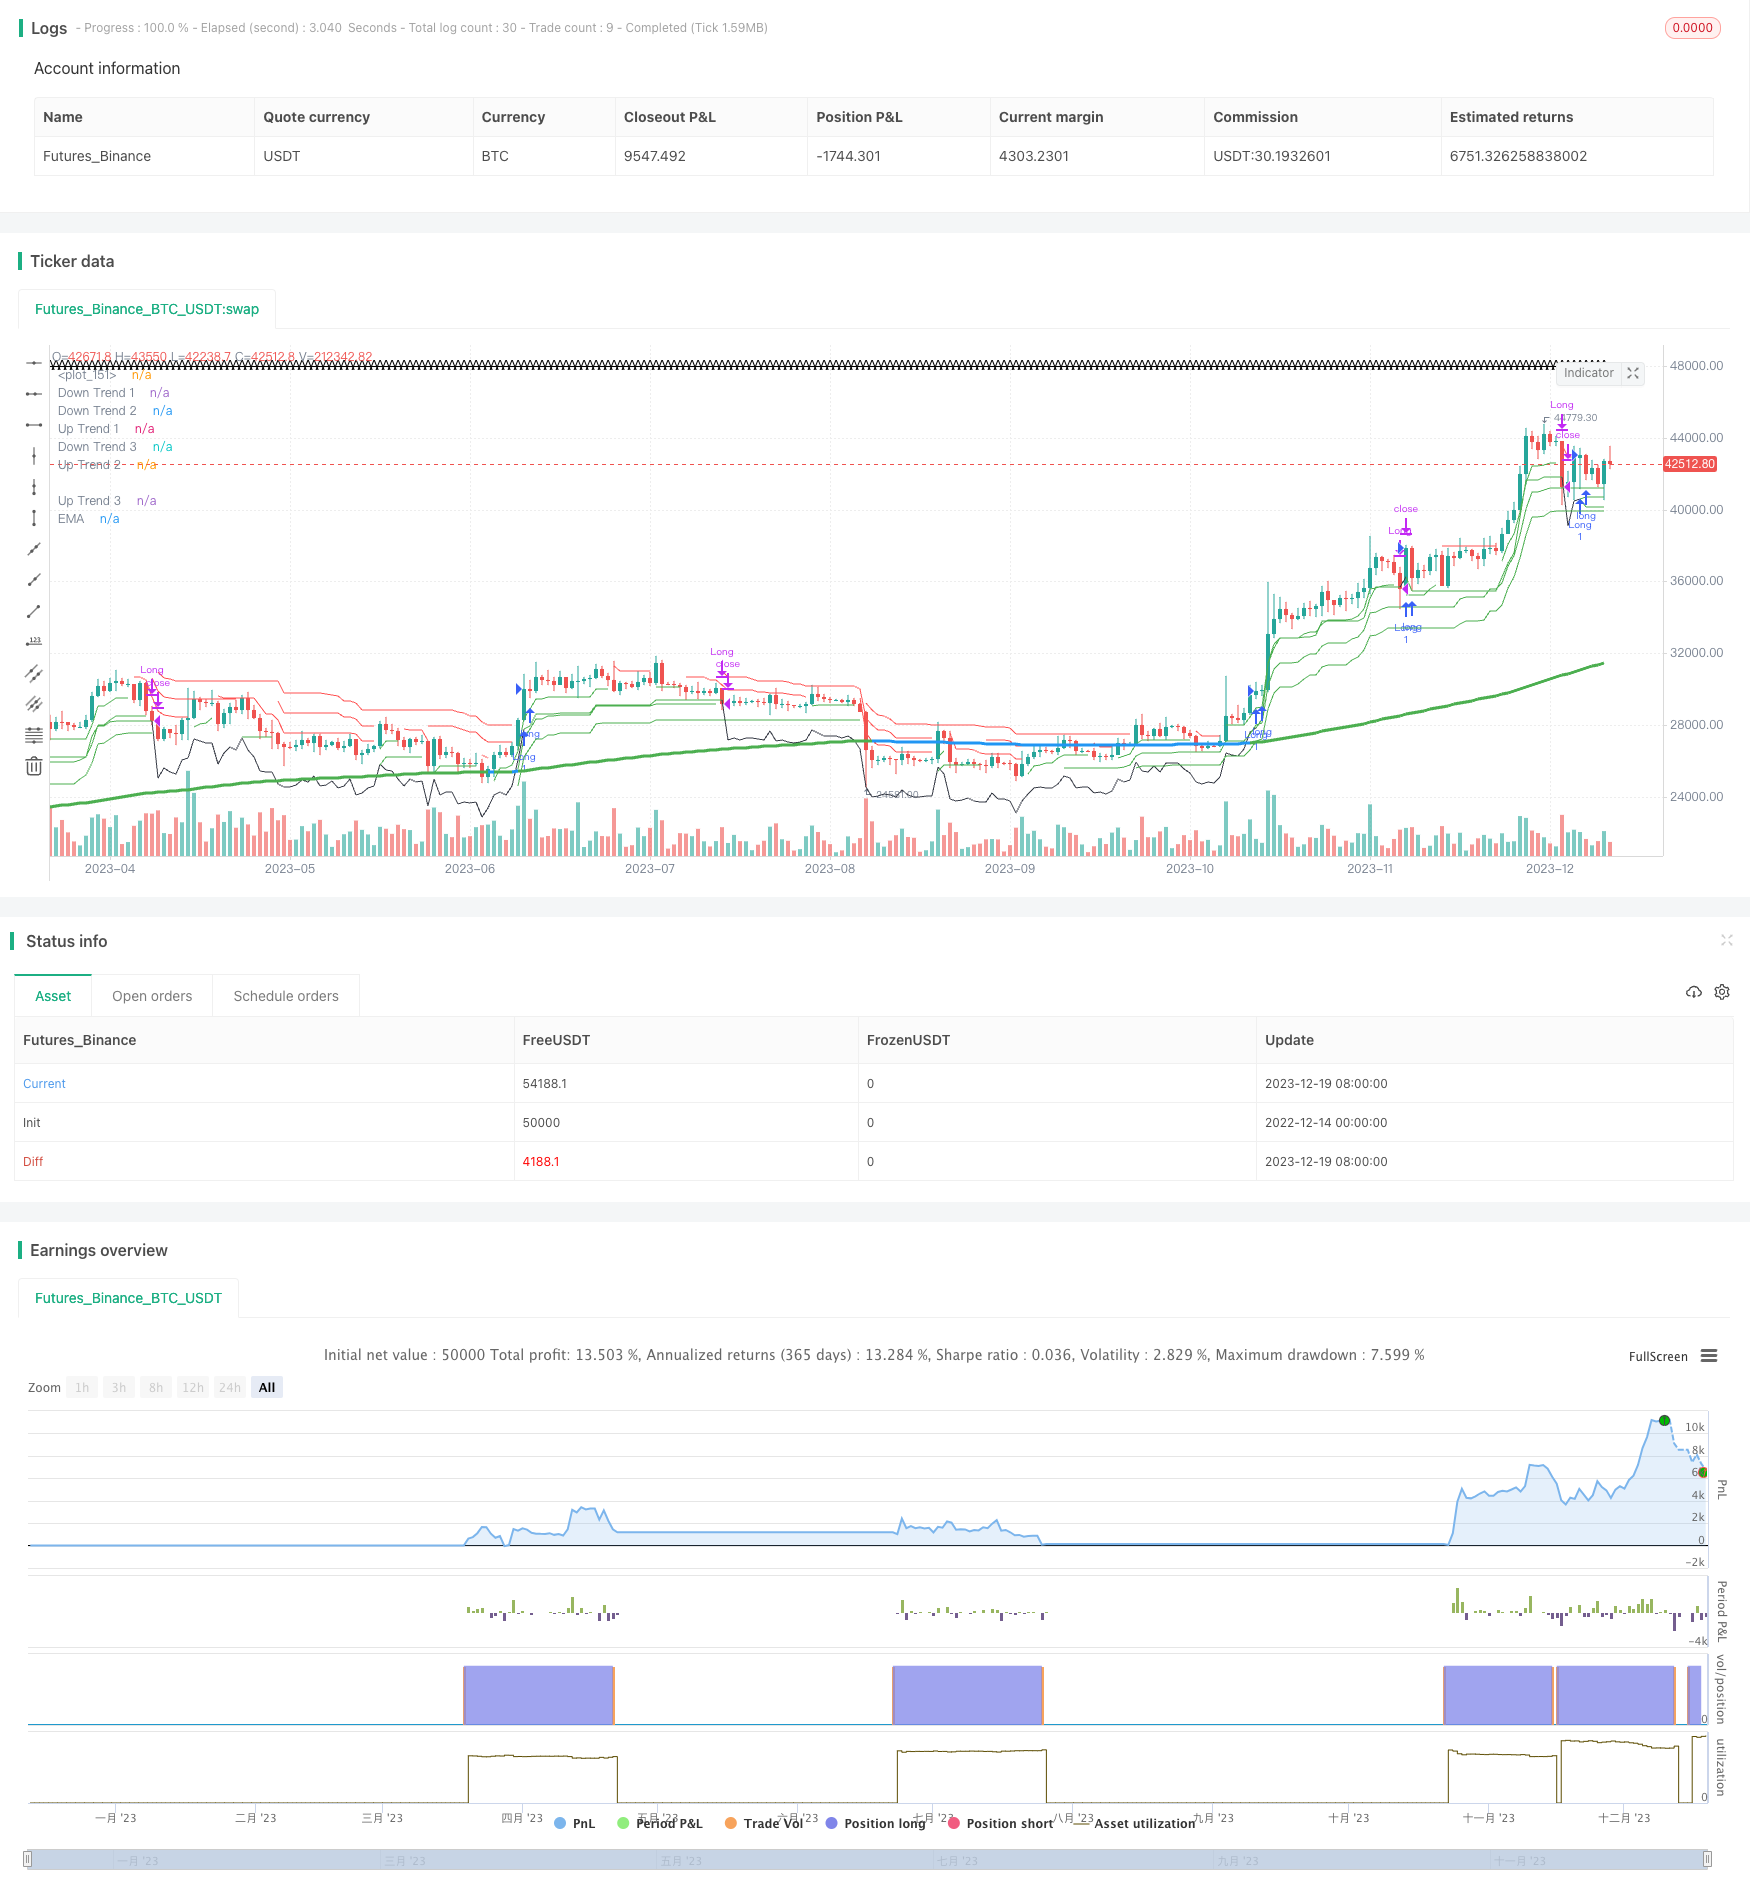
La estrategia triple breakout es una estrategia más común para identificar la dirección de la tendencia y operar con el uso de la EMA de la tendencia definida y la EMA de la tendencia definida en varios parámetros diferentes. La idea principal de la estrategia es que se establezcan las líneas de la tendencia superior cuando al menos dos líneas de la EMA de la tendencia superior se encuentran en el estado de la pluralidad; cuando al menos dos líneas de la EMA de la tendencia superior se encuentran en el estado de la vacuidad.
Principio de estrategia
La estrategia se basa en la creación de posiciones de equilibrio mediante el establecimiento de tres parámetros diferentes: una línea media de tendencia súper y un EMA que define la dirección de la tendencia general:
Configure tres líneas supertrend supertrend1, supertrend2 y supertrend3, los colores verde para la tendencia alcista y rojo para la tendencia bajista.
Establezca una EMA de ematrend para definir la tendencia mayor, cuando las tres medias supertrend son todas más altas que la EMA se define como una tendencia mayor de la bolsa, por el contrario se define como una tendencia a la baja.
Cuando al menos dos líneas medias de tendencia superior se muestran simultáneamente en el caso de que el disco sea múltiple, se considera una señal de múltiple cuando el valor de la dirección es menor que 0. Cuando al menos dos líneas medias de tendencia superior se muestran simultáneamente en el caso de que el disco esté vacío, se considera una señal de vacío cuando el valor de la dirección es mayor que 0.
Luego, cuando se emite la señal, se abre la posición para hacer más / hacer menos.
Establezca una condición de parada de pérdidas. Donde la parada fija se establece como la tasa de retorno al riesgo, es decir, la tasa de pérdidas y ganancias es de 3; La parada móvil se establece como una pérdida de pérdidas ATR.
Cuando se activan las condiciones de stop loss o de stop, se cierra la posición.
Análisis de las ventajas
La estrategia tiene las siguientes ventajas:
El uso de la triple línea media supertrend combinada con la EMA para determinar la tendencia, permite identificar eficazmente las señales de tendencia.
Las reglas de juicio condicional de la pluralidad de espacios son claras, fáciles de entender y de implementar.
Configuración de paradas móviles y paradas fijas para controlar el riesgo de manera efectiva.
Se pueden ajustar los hiperparámetros según sea necesario para optimizar la estrategia.
Análisis de riesgos
La estrategia también tiene ciertos riesgos:
La configuración incorrecta de los hiperparámetros puede causar la pérdida de una buena oportunidad de negociación. Se pueden probar diferentes parámetros de ciclo ATR, multiplicador ATR y ciclo EMA.
La probabilidad de fracaso de la brecha existe y puede reducirse ajustando el parámetro de superposición.
El stop loss o el stop loss demasiado flexible aumenta la probabilidad de pérdidas. Se debe restringir adecuadamente el rango de stop loss.
Los datos de retroalimentación pueden generar problemas de sobreconformidad. Se debe tener en cuenta la prueba de múltiples mercados y múltiples ciclos.
Dirección de optimización
La estrategia puede ser optimizada en los siguientes aspectos:
Prueba de la mejor combinación de hiperparámetros. Puede combinar pruebas de diferentes períodos de ATR, multiplicadores de ATR y períodos de promedio de EMA para encontrar el mejor parámetro.
Aumentar la variedad de transacciones. Se pueden agregar diferentes variedades como acciones, monedas digitales y otras para verificar la efectividad de la estrategia.
En combinación con otros indicadores, se puede filtrar la señal. Por ejemplo, se puede agregar indicadores como RSI, MACD para evitar una mala lectura de la señal de tendencia.
Optimización de los mecanismos de detención de pérdidas. Se puede probar el seguimiento de las pérdidas o la detención de las pérdidas basadas en los cambios en el ATR / fluctuación.
Resumir
La estrategia de la ruptura de la línea de la media de la tendencia triple es una estrategia de seguimiento de la tendencia más sencilla y práctica en general. Combina varias líneas de la media de la tendencia y el juicio de la tendencia para descubrir oportunidades y controlar el riesgo de manera efectiva.
/*backtest
start: 2022-12-14 00:00:00
end: 2023-12-20 00:00:00
period: 1d
basePeriod: 1h
exchanges: [{"eid":"Futures_Binance","currency":"BTC_USDT"}]
*/

// @version=5
// author=theasgard and moonshot-indicator (ms)
// year 2021
//
// This is a well knowen strategy by using 3 different Supertrends and a trend-defining EMA,
// feel free to play around with the settings, a backtest on 8h ETHUSDT pair brought some good results using
// the 233EMA and investing 75% of a 10k start capital
//
// the idea is to have at least 2 supertrnds going green above the trend-EMA to go long and exit by turning
// 2 supertrends red (idea: 1 supertrend in red could initialize a take profit)
// shorts work vice versa
// The EMA shows in green for uptrends and in red for downtrends, if it is blue no Signal will be taken because
// the 3 supertrends are not all above or below the trendline(EMA)
//
// Update 1:
// Fixed a minor input error
// Added ATR stoploss, and commented out the percentage stop loss
// Added time window to backtest
// Added exit on risk/revard is met
// This version is only buy...wait for next update adding shorts

strategy("ms hypertrender", overlay=true)

// set up 3 supertrendlines and colour the direction up/down
atrPeriod1 = input(10, "ATR Length 1")
factor1 = input.float(1.0, "ATR Factor 1", step = 0.01)
[supertrend1, direction1] = ta.supertrend(factor1, atrPeriod1)
upTrend1 = plot(direction1 < 0 ? supertrend1 : na, "Up Trend 1", color = color.green, style=plot.style_linebr)
downTrend1 = plot(direction1 < 0? na : supertrend1, "Down Trend 1", color = color.red, style=plot.style_linebr)

atrPeriod2 = input(11, "ATR Length 2")
factor2 = input.float(2.0, "ATR Factor 2", step = 0.01)
[supertrend2, direction2] = ta.supertrend(factor2, atrPeriod2)
upTrend2 = plot(direction2 < 0 ? supertrend2 : na, "Up Trend 2", color = color.green, style=plot.style_linebr)
downTrend2 = plot(direction2 < 0? na : supertrend2, "Down Trend 2", color = color.red, style=plot.style_linebr)

atrPeriod3 = input(12, "ATR Length 3")
factor3 = input.float(3.0, "ATR Factor 3", step = 0.01)
[supertrend3, direction3] = ta.supertrend(factor3, atrPeriod3)
upTrend3 = plot(direction3 < 0 ? supertrend3 : na, "Up Trend 3", color = color.green, style=plot.style_linebr)
downTrend3 = plot(direction3 < 0? na : supertrend3, "Down Trend 3", color = color.red, style=plot.style_linebr)

//set up the trend dividing EMA and color uptrend nutreal downtrend
len = input.int(233, minval=1, title="Trend-EMA Length")
src = input(close, title="Source")
offset = input.int(title="Offset", defval=0, minval=-500, maxval=500)

//general Bull or Bear Trend? Visualized by ema
ematrend = ta.ema(src, len)
generaluptrend = supertrend1 > ematrend and supertrend2 > ematrend and supertrend3 > ematrend
generaldowntrend = supertrend1 < ematrend and supertrend2 < ematrend and supertrend3 < ematrend
emacolor = if generaluptrend
    color.green
else if generaldowntrend
    color.red
else
    color.blue
plot(ematrend, title="EMA", color=emacolor, linewidth=3, offset=offset)

// Bullish? min 2 supertrends green
bullish = (direction1 < 0 and direction2 < 0) or (direction1 < 0 and direction3 < 0) or (direction2 < 0 and direction3 < 0) and generaluptrend
extremebullish = direction1 < 0 and direction2 < 0 and direction3 < 0 and generaluptrend //all 3 green

// Bearish? min 2 supertrends red
bearish = (direction1 > 0 and direction2 > 0) or (direction1 > 0 and direction3 > 0) or (direction2 > 0 and direction3 > 0) and generaldowntrend
extremebearish = direction1 > 0 and direction2 > 0 and direction3 > 0 and generaldowntrend //all 3 red

// Open Long
//plotchar(((bullish and not bullish[1]) or (extremebullish and not extremebullish[1])) and (emacolor==color.green)? close : na, title = 'Start Long', char='▲', color = #80eb34, location = location.belowbar, size = size.small)

// TP 10% Long
TP10long = ((generaluptrend and bullish[1]) or (generaluptrend and extremebullish[1])) and (direction1 > 0 or direction2 > 0 or direction3 > 0)
//plotchar(TP10long and not TP10long[1]? close : na, title = 'TP on Long', char='┼', color = #ffd000, location = location.abovebar, size = size.tiny)

// Exit Long
//plotchar(extremebearish and not extremebearish[1] or bearish and not bearish[1]? close : na, title = 'Close all Longs', char='Ꭓ', color = #ff0037, location = location.abovebar, size = size.tiny)
stopsupertrendup = if supertrend1 < supertrend2 and supertrend1 < supertrend3
    (supertrend1)
else if supertrend2 < supertrend1 and supertrend2 < supertrend3
    (supertrend2)
else if supertrend3 < supertrend1 and supertrend3 < supertrend2
    (supertrend3)
lowestLows = ta.lowest(low, 1)
// Open Short
//plotchar(((bearish and not bearish[1]) or (extremebearish and not extremebearish[1])) and (emacolor==color.red)? close : na, title = 'Start Short', char='▼', color = #0547e3, location = location.abovebar, size = size.small)

// TP 10% Short
TP10short = ((generaldowntrend and bearish[1]) or (generaldowntrend and extremebearish[1])) and (direction1 < 0 or direction2 < 0 or direction3 < 0)
//plotchar(TP10short and not TP10short[1]? close : na, title = 'TP on Short', char='┼', color = #ffd000, location = location.belowbar, size = size.tiny)

// Exit Short
//plotchar(extremebullish and not extremebullish[1] or bullish and not bullish[1]? close : na, title = 'Close all Shorts', char='Ꭓ', color = #ff0037, location = location.belowbar, size = size.tiny)
stopsupertrenddown = if supertrend1 > supertrend2 and supertrend1 > supertrend3
    (supertrend1)
else if supertrend2 > supertrend1 and supertrend2 > supertrend3
    (supertrend2)
else if supertrend3 > supertrend1 and supertrend3 > supertrend2
    (supertrend3)
highestHighs = ta.highest(high,1)
// Set stop loss level with input options (optional)
//longLossPerc = input.float(title="Long Stop Loss (%)",
//     minval=0.0, step=0.1, defval=1) * 0.01

//shortLossPerc = input.float(title="Short Stop Loss (%)",
//     minval=0.0, step=0.1, defval=1) * 0.01

// Determine stop loss price
//longStopPrice  = strategy.position_avg_price * (1 - longLossPerc)
//shortStopPrice = strategy.position_avg_price * (1 + shortLossPerc)

openlong = (extremebullish and not extremebullish[1]) and (emacolor==color.green)//(((bullish and not bullish[1]) or
openshort = (extremebearish and not extremebearish[1]) and (emacolor==color.red)//(((bearish and not bearish[1]) or
exitlong = lowestLows<(stopsupertrendup - ((stopsupertrendup / 100) * 0.1)) //(extremebearish and not extremebearish[1] or bearish and not bearish[1]) or TP10long or
exitshort = highestHighs>(stopsupertrenddown - ((stopsupertrenddown / 100) * 0.1)) //(extremebullish and not extremebullish[1] or bullish and not bullish[1]) or TP10short
//strategy.entry("buy", strategy.long, when=openlong)
//strategy.entry("sell", strategy.short, when=openshort)

//strategy.close("buy", when=exitlong)
//strategy.close("sell", when=exitshort)

// Submit exit orders based on calculated stop loss price
//if (strategy.position_size > 0)
//    strategy.exit(id="Long Stop", stop=longStopPrice)

//if (strategy.position_size < 0)
//    strategy.exit(id="Short Stop", stop=shortStopPrice)

backtest_timeframe_start = input(defval = timestamp("01 Apr 2016 13:30 +0000"), title = "Backtest Start Time")
USE_ENDTIME = input(false,title="Define the ending period for backtests (If false, will test up to most recent candle)")
backtest_timeframe_end = input(defval = timestamp("19 Mar 2021 19:30 +0000"), title = "Backtest End Time")
TARGET_PROFIT_MODE = input(false,title="Exit when Risk:Reward met")
REWARD_RATIO = input(3,title="Risk:[Reward] (i.e. 3) for exit")
// Trailing stop loss {
TSL_ON = input(true,title="Use trailing stop loss")
var entry_price = float(0)
ATR_multi_len = 26
ATR_multi = input(2, "ATR multiplier for stop loss")
ATR_buffer = ta.atr(ATR_multi_len) * ATR_multi
plotchar(ATR_buffer, "ATR Buffer", "A", location = location.top)
risk_reward_buffer = (ta.atr(ATR_multi_len) * ATR_multi) * REWARD_RATIO
take_profit_long = low > entry_price + risk_reward_buffer
take_profit_short = low < entry_price - risk_reward_buffer
var trailing_SL_buffer = float(0)
var stop_loss_price = float(0)
stop_loss_price := math.max(stop_loss_price, close - trailing_SL_buffer)
// plot TSL line
trail_profit_line_color = color.green
if strategy.position_size == 0  or not TSL_ON
    trail_profit_line_color := color.black
    stop_loss_price := close - trailing_SL_buffer
plot(stop_loss_price,color=trail_profit_line_color)
// }

if true
    buy_condition = openlong
    exit_condition = exitlong
    //ENTRY:
    if buy_condition
        if strategy.position_size == 0
            entry_price := close
            trailing_SL_buffer := ATR_buffer
            stop_loss_price := close - ATR_buffer

        msg = "entry"
        if strategy.position_size > 0
            msg := "pyramiding"
        strategy.entry("Long",strategy.long, comment=msg)

    //EXIT:
    // Case (A) hits trailing stop
    if TSL_ON and strategy.position_size > 0 and close <= stop_loss_price
        if close > entry_price
            strategy.close("Long", comment="take profit [trailing]")
        else if close <= entry_price
            strategy.close("Long", comment="stop loss")
    // Case (B) take targeted profit relative to risk
    if strategy.position_size > 0 and TARGET_PROFIT_MODE
        if take_profit_long
            strategy.close("Long", comment="take profits [risk:reward]")
    // Case (C)
    if strategy.position_size > 0 and exit_condition
        if take_profit_long
            strategy.close("Long", comment="exit[rsi]")