Estrategia cuantitativa combinada de triple media móvil y MACD
Descripción general
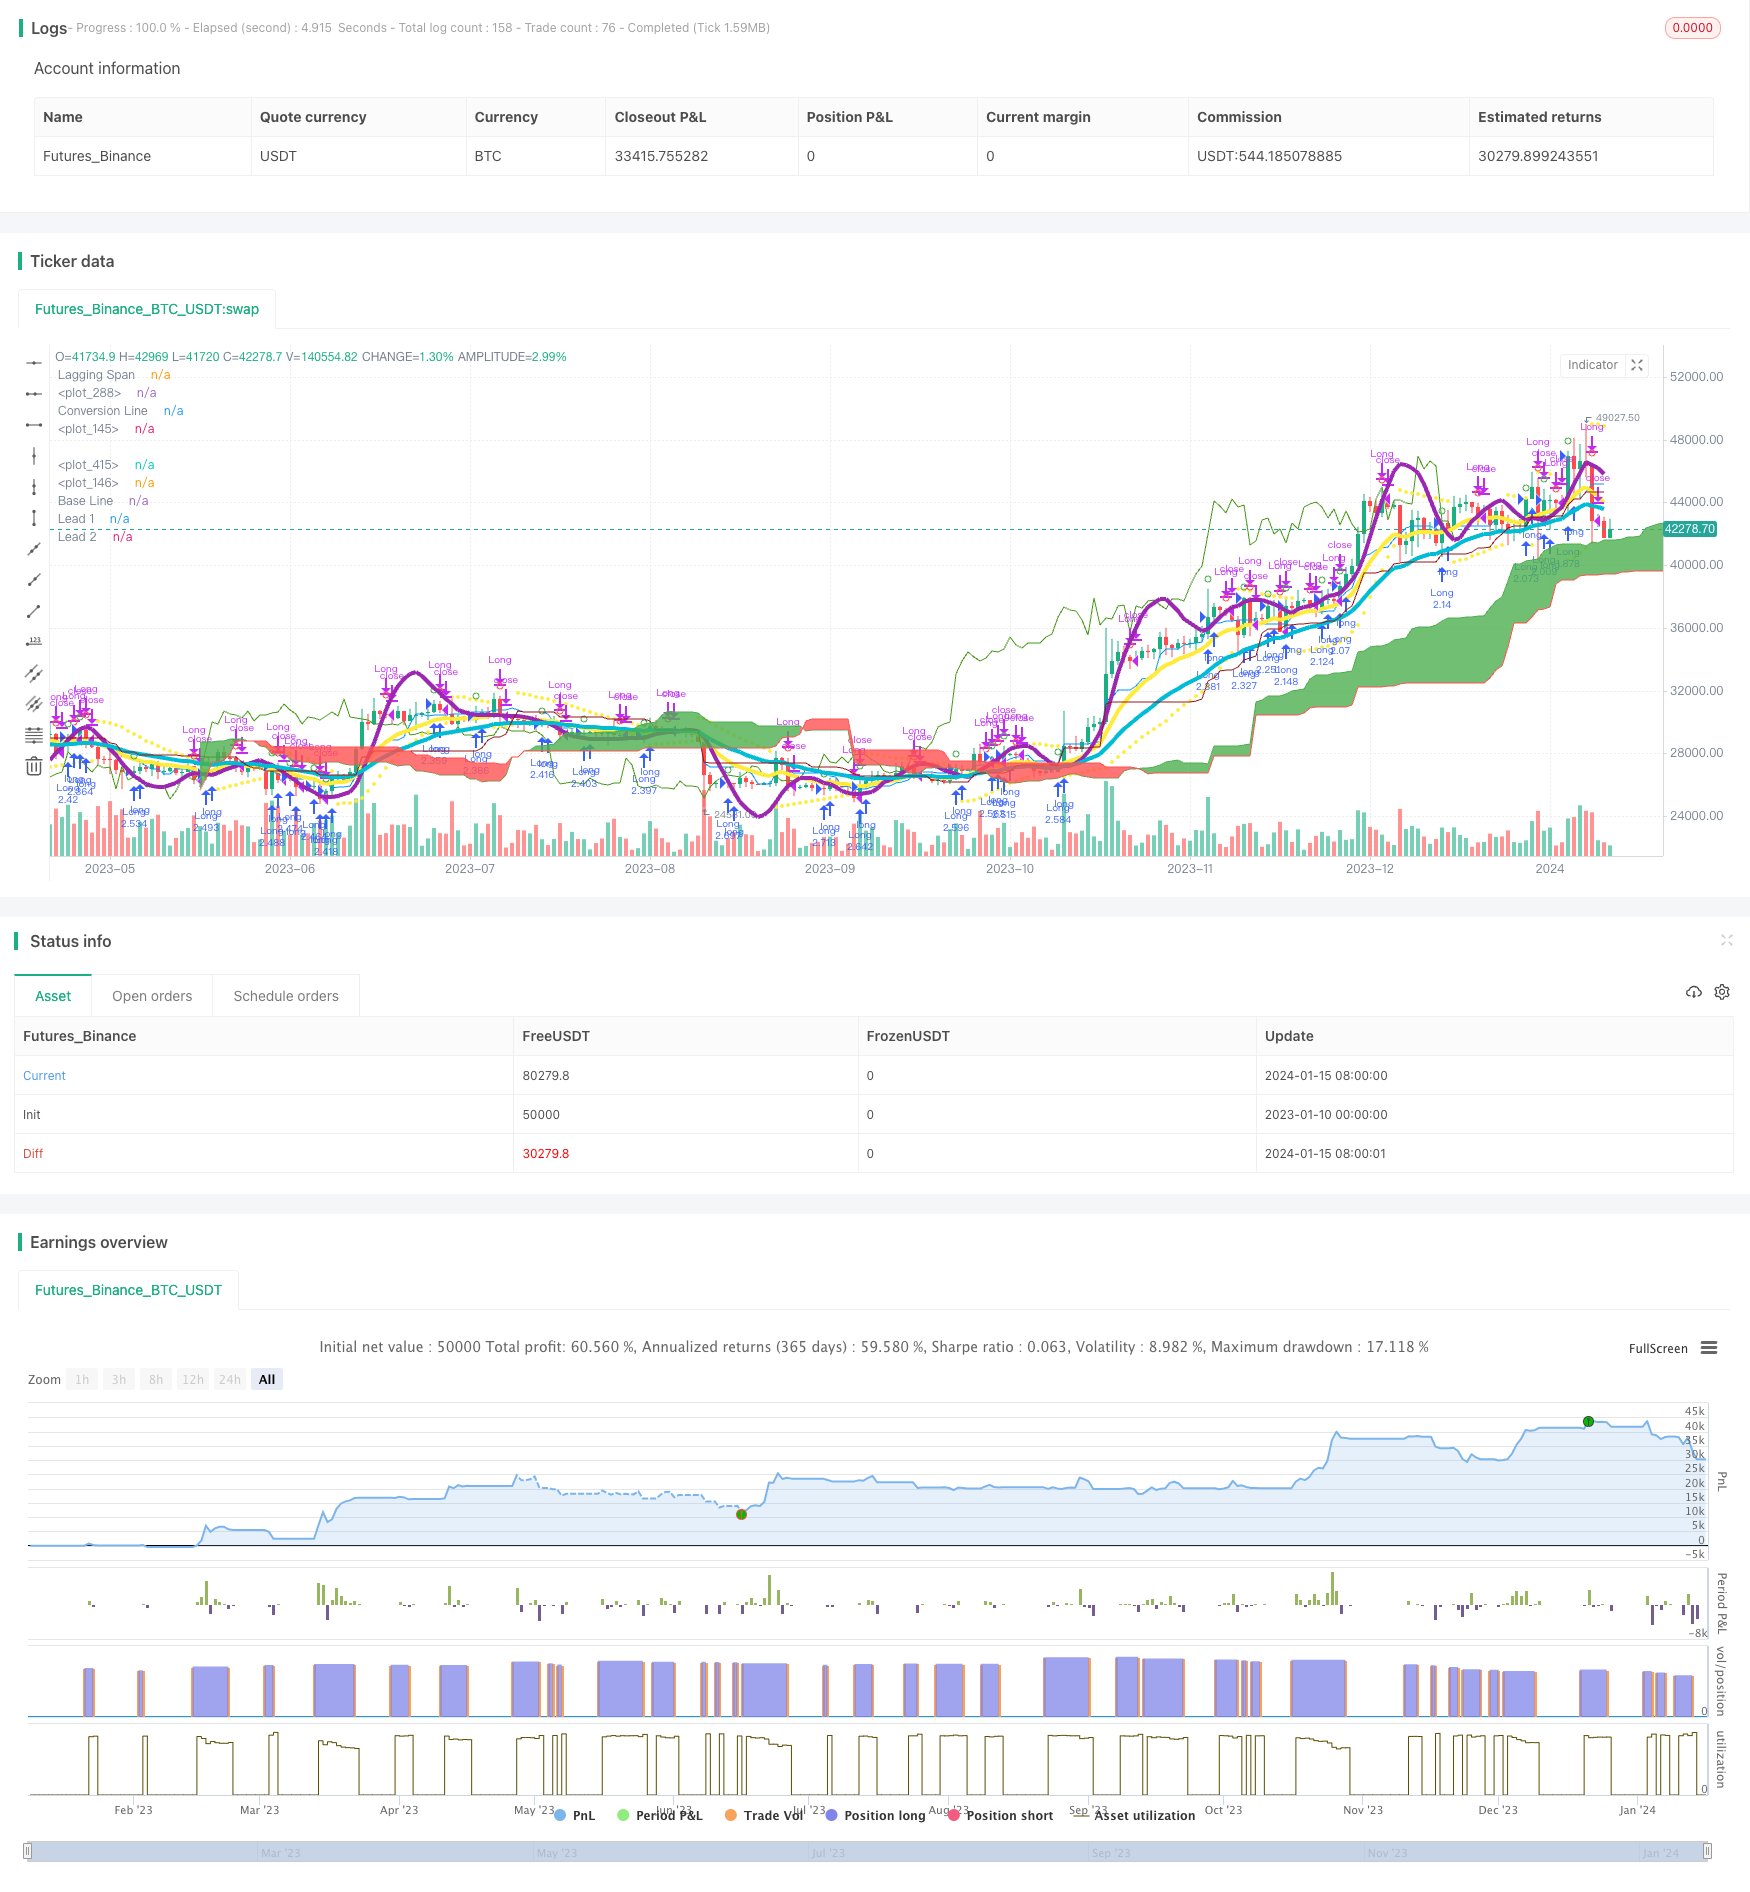
Esta estrategia utiliza una combinación de indicadores de triple media móvil y MACD para desarrollar una estrategia de comercio cuantitativa más estable y confiable. La estrategia está diseñada para capturar las tendencias que pueden aparecer en el futuro, especialmente para las posiciones medias y largas.
Principio de estrategia
La estrategia se basa principalmente en el uso combinado de las medias móviles triples y el indicador MACD.
En primer lugar, la estrategia utiliza tres promedios móviles exponenciales triples de 3, 7 y 2 longitudes respectivamente. Estos tres promedios móviles construyen un sistema de promedios móviles rápidos y lentos para determinar la dirección de las tendencias futuras.
En segundo lugar, la estrategia también utiliza el indicador MACD con los parámetros 3 y 7. Cuando el MACD cruza la línea de señal en la línea principal, se hace una señal múltiple, y la baja se hace una señal vacía.
El uso combinado de dos indicadores permite evitar múltiples señales erróneas causadas por un solo indicador, lo que mejora la estabilidad de la estrategia.
Ventajas estratégicas
- Filtración de doble indicador para mejorar la calidad de la señal
- Parámetros optimizados por múltiples pruebas, estabilidad y fiabilidad
- El triple promedio móvil permite filtrar el ruido del mercado y determinar tendencias futuras.
- Los parámetros del indicador MACD son más rápidos para capturar oportunidades a corto plazo
Riesgo estratégico
- Existe cierto riesgo de retiro y pérdidas continuas
- La estrategia se aplica cuando no hay una tendencia evidente y se producen más transacciones erróneas.
- Los indicadores MACD son propensos a generar señales erróneas y deben usarse en combinación con indicadores de línea media
La solución:
- La adopción de una estrategia de alto riesgo adecuada para controlar el máximo retiro
- Reducir la frecuencia de las operaciones cuando el estado del mercado es claramente sin tendencia
- Optimización de los parámetros MACD y su uso en combinación con otros indicadores
Dirección de optimización de la estrategia
- Prueba y optimiza los parámetros de las medias móviles y MACD para encontrar la mejor combinación
- Aumentar indicadores auxiliares como KDJ, VRSI y evitar señales erróneas
- El uso de modelos de aprendizaje automático para determinar el estado del mercado y realizar ajustes dinámicos
- Establecer el punto de parada óptimo junto con la estrategia de parada
Resumir
Esta estrategia capta una tendencia estable a través de una combinación de medias móviles y MACD. Su ventaja estratégica reside en que el uso de una combinación de indicadores reduce de manera efectiva las señales erróneas, lo que permite obtener un mejor efecto de la estrategia. A continuación, se perfecciona aún más la estrategia mediante la optimización de parámetros, la introducción de estrategias de parada y ajuste dinámico, para que sea una herramienta eficaz para encontrar oportunidades en la línea media.
/*backtest
start: 2023-01-10 00:00:00
end: 2024-01-16 00:00:00
period: 1d
basePeriod: 1h
exchanges: [{"eid":"Futures_Binance","currency":"BTC_USDT"}]
*/

//@version=3
strategy("Matt's MACD Algo v1", shorttitle="Matt's MACD Algo v1", overlay=true, pyramiding = 0, default_qty_type = strategy.percent_of_equity, default_qty_value = 100, initial_capital=7000, calc_on_order_fills = true, commission_type=strategy.commission.percent, commission_value=0, currency = currency.USD)
//study("MFI Fresh", shorttitle="MFI Fresh", overlay=true)

//Risk Management Settings
//trategy.risk.max_drawdown(20, strategy.percent_of_equity)
//strategy.risk.max_intraday_loss(10, strategy.percent_of_equity)
//strategy.risk.max_cons_loss_days(3)

/////////////////
ts = input(title="Trailing Stop in cents", defval=50)/100

//Time Inputs
FromMonth = input(defval = 6, title = "From Month", minval = 1)
FromDay   = input(defval = 1, title = "From Day", minval = 1)
FromYear  = input(defval = 2017, title = "From Year", minval = 1)
ToMonth   = input(defval = 1, title = "To Month", minval = 1)
ToDay     = input(defval = 1, title = "To Day", minval = 1)
ToYear    = input(defval = 9999, title = "To Year", minval = 1)

//Time Variable
testPeriod() =>
    (time > timestamp(FromYear, FromMonth, FromDay, 09, 30)) and (time < timestamp(ToYear, ToMonth, ToDay, 09, 29))

//MA On and MA Colors On? Inputs
switch1=input(false, title="Enable Bar Color?")
switch2=input(true, title="Enable Moving Averages?")
switch3=input(false, title="Enable Background Color?")
switch4=input(false, title="Enable Bolinger Bands?")
switch5=input(false, title="Enable Keltner Channel?")

////////////////////////////////Williams %R
R_length = input(14, minval=1)
R_overBought = input(title="%R Overbought", defval=80)
R_overSold = input(title="%R Oversold", defval=20)
R_upper = highest(R_length)
R_lower = lowest(R_length)
R_out = 100 * (close - R_upper) / (R_upper - R_lower)

WilliamsR_longEntry = crossover(R_out, R_overSold)
WilliamsR_shortEntry = crossunder(R_out, R_overBought)

//plot(R_out)
//R_band1 = hline(R_overSold)
//R_band0 = hline(R_overBought)
//fill(R_band1, R_band0)

////////////////////////////////RSI Variables
rsi_source = close
RSI_Length = input(title="RSI Length", defval=3)
RSI_overBought = input(title="RSI Overbought", defval=80)
RSI_overSold = input(title="RSI Oversold", defval=20)

up = rma(max(change(rsi_source), 0), RSI_Length)
down = rma(-min(change(rsi_source), 0), RSI_Length)
rsi = down == 0 ? 100 : up == 0 ? 0 : 100 - (100 / (1 + up / down))

RSI_longEntry = rsi > 50
//crossover(rsi, RSI_overSold)
RSI_shortEntry = rsi < 50
//crossunder(rsi, RSI_overBought)

//plot(rsi, color=purple)
//band1 = hline(RSI_overBought)
//band0 = hline(RSI_overSold)
//fill(band1, band0, color=purple, transp=90)


//////////////////////Commodity Channel Index
cci_length = input(20, minval=1)
cci_src = input(close, title="Source")
cci_ma = sma(cci_src, cci_length)
cci = (cci_src - cci_ma) / (0.015 * dev(cci_src, cci_length))


cci_longEntry = crossover(cci, -100)
cci_shortEntry = crossunder(cci, 100)

//plot(cci, color=olive)
//cci_band1 = hline(100, color=gray, linestyle=dashed)
//cci_band0 = hline(-100, color=gray, linestyle=dashed)
//fill(cci_band1, cci_band0, color=olive)


//MFI Inputs
MFI_length = input(title="MFI Length", defval=3)
MFI_overBought = input(title="MFI Overbought", defval=80)
MFI_overSold = input(title="MFI Oversold", defval=20)

//MFI Variables
rawMoneyFlow = hlc3 * volume
positiveMoneyFlow = 0.0
positiveMoneyFlow := hlc3 > hlc3[1] ? positiveMoneyFlow + rawMoneyFlow : positiveMoneyFlow
negativeMoneyFlow = 0.0
negativeMoneyFlow :=  hlc3 < hlc3[1] ? negativeMoneyFlow + rawMoneyFlow : negativeMoneyFlow
moneyFlowRatio = sma(positiveMoneyFlow, MFI_length) / sma(negativeMoneyFlow, MFI_length)
moneyFlowIndex = 100 - 100 / (1 + moneyFlowRatio)

MFI_longEntry = (crossover(moneyFlowIndex, MFI_overSold))
MFI_shortEntry = (crossunder(moneyFlowIndex, MFI_overBought))


///// MFI Plot for STUDY
//plot(moneyFlowIndex, color=#459915)
//MFI_OB=hline(MFI_overBought, title="Overbought", color=#c0c0c0)
//MFI_OS=hline(MFI_overSold, title="Oversold", color=#c0c0c0)
//fill(MFI_overBought, MFI_overSold, color=#9915ff, transp=90)


////VERY SLOW SMA
veryslowLength=input(50,minval=1, title="Very slow SMA")
veryslowSMA = sma(close, veryslowLength)


//MACD Inputs
source = input(close, title="MACD source")
fastLength = input(title="MACD Fast Length", defval=12)
fastLength2 = input(title="MACD Fast Length #2", defval=3)
slowLength = input(title="MACD Slow Length", defval=26)
slowLength2 = input(title="MACD Slow Length #2", defval=7)
MACD_fastsignalSmoothing = input(title="Signal Smoothing", defval=7)
MACD_slowsignalSmoothing = input(title="Signal Smoothing", defval=12)
MACD_fastsignalSmoothing2 = input(title="Signal Smoothing #2", defval=5)
MACD_slowsignalSmoothing2 = input(title="Signal Smoothing #2", defval=9)
MACD_percentthreshold = input(title="MACD % Threshold", defval=-0.0030, step=0.0001)

//MACD variables
fastEMA = ema(source, fastLength)
fastEMA2 = ema(source, fastLength2)
slowEMA = ema(source, slowLength)
slowEMA2 = ema(source, slowLength2)
MACD_Line = fastEMA - slowEMA
MACD_Line2 = fastEMA2 - slowEMA2
MACD_fastsignalLine = ema(MACD_Line, MACD_fastsignalSmoothing)
MACD_slowsignalLine = ema(MACD_Line, MACD_slowsignalSmoothing)
MACD_fastsignalLine2 = ema(MACD_Line2, MACD_fastsignalSmoothing2)
MACD_slowsignalLine2 = ema(MACD_Line2, MACD_slowsignalSmoothing2)
fasthist = MACD_Line - MACD_slowsignalLine
MACD_Histogram2 = MACD_Line2 - MACD_fastsignalLine2
minimum = close * MACD_percentthreshold
SMA = sma(MACD_Line, 10)

// MACD and veryslowSMA Plot for STRATEGY
Fast=plot(switch2?fastEMA:na,color=yellow, linewidth=4)
Slow=plot(switch2?slowEMA:na,color=aqua, linewidth=4)
//VerySlow=plot(switch2?veryslowSMA:na,color=purple,linewidth=4)
//fill(Fast,VerySlow,color=gray)

/////// MACD Plots for STUDY
//plot(fasthist, color=fasthist>0 and fasthist[0]>fasthist[1]?#00ff00:fasthist<=0 and fasthist[0]<fasthist[1]?#f72e2e:fasthist>0 and fasthist[0]<fasthist[1]?#008000:fasthist<0 and fasthist[0]>fasthist[1]?#7f0000:white, style=histogram)
//plot(slowhist, color=slowhist>0 and slowhist[0]>slowhist[1]?#00ff00:slowhist<=0 and slowhist[0]<slowhist[1]?#f72e2e:slowhist>0 and slowhist[0]<slowhist[1]?#008000:slowhist<0 and slowhist[0]>slowhist[1]?#7f0000:white, style=histogram)
//plot(MACD_Line, color=yellow, title="MACD Line")
//plot(MACD_fastsignalSmoothing, color=green, title="Fast Signal Line")
//plot(MACD_slowsignalSmoothing, color=red, title="Slow Signal Line")
//plot(MACD_Line2, color=aqua, title="MACD Line 2")
//plot(MACD_fastsignalSmoothing2, color=orange, title="Fast Signal Line 2")
//plot(MACD_slowsignalSmoothing2, color=white, title="Slow Signal Line 2")
//plot(minimum, color=white, title="% Threshold")
//plot(fasthist, color=fasthist>0 and fasthist[0]>fasthist[1]?#00ff00:fasthist<=0 and fasthist[0]<fasthist[1]?#f72e2e:fasthist>0 and fasthist[0]<fasthist[1]?#008000:fasthist<0 and fasthist[0]>fasthist[1]?#7f0000:white, style=histogram)
//plot(MACD_Histogram2, color=MACD_Histogram2>0?blue:MACD_Histogram2<0?orange:white, style=histogram)
//plot(SMA, color=white, title="SMA")

//MACD Entry Conditions
MACD_longEntry2 = (crossover(MACD_Histogram2, 0))
MACD_shortEntry2 = (crossunder(MACD_Histogram2, 0))
MACD_longEntry = (crossover(fasthist, 0))
MACD_shortEntry = (crossunder(fasthist, 0))


// Colors
//MAtrendcolor = change(veryslowSMA) > 0 ? green : red
//trendcolor = fastEMA > slowEMA and change(veryslowSMA) > 0 and close > slowEMA ? green : fastEMA < slowEMA and change(veryslowSMA) < 0 and close < slowEMA ? red : yellow
//bartrendcolor = close > fastEMA and close > slowEMA and close > veryslowSMA and change(slowEMA) > 0 ? green : close < fastEMA and close < slowEMA and close < veryslowSMA and change(slowEMA) < 0 ? red : yellow
//backgroundcolor = slowEMA > veryslowSMA and MACD_longEntry and MACD_Line > 0 and fastEMA > slowEMA and close[slowLength] > veryslowSMA ? green : slowEMA < veryslowSMA and MACD_shortEntry and MACD_Line < 0 and fastEMA < slowEMA and close[slowLength] < veryslowSMA ? red : na
//barcolor(switch1?bartrendcolor:na)

// Conditional Bar Colors
//backgroundcolor = (MACD_longEntry ? green : MACD_shortEntry ? red : na)
//bgcolor(switch3?backgroundcolor:na,transp=80)


////BOLLINGER BAND Conditions
bb_source = close
bb_length = input(20, minval=1)
bb_mult = input(1.86, minval=0.001, maxval=50)

bb_basis = ema(bb_source, bb_length)
bb_dev = bb_mult * stdev(bb_source, bb_length)

bb_upper = bb_basis + bb_dev
bb_lower = bb_basis - bb_dev

bb_longEntry = crossover(bb_source, bb_lower)
bb_shortEntry = crossunder(bb_source, bb_upper)

plot(switch4?bb_basis:na, color=red, linewidth=4)
p1=plot(switch4?bb_upper:na)
p2=plot(switch4?bb_lower:na)
fill(p1,p2, color=aqua, transp=95)

////KELTNER CHANNEL Inputs/Variables/Plots
KC_useTrueRange = input(true)
KC_length = input(20, minval=1)
KC_mult = input(3.0)
KC_source = input(close, title="Source")

KC_ma = ema(KC_source, KC_length)
KC_range = KC_useTrueRange ? tr : high - low
KC_rangema = ema(KC_range, KC_length)
KC_upper = KC_ma + KC_rangema * KC_mult
KC_lower = KC_ma - KC_rangema * KC_mult

KC_longEntry = crossover(KC_source, KC_lower)
KC_shortEntry = crossunder(KC_source, KC_upper)

plot(switch5?KC_ma:na, color=red, title="Basis")
KC_u = plot(switch5?KC_upper:na, color=red, title="Upper")
KC_l = plot(switch5?KC_lower:na, color=red, title="Lower")
fill(KC_u, KC_l, color=red)

///////////////////ADX
//len = input(title="ADX Length", type=integer, defval=14)
//th = input(title="ADX threshold", type=integer, defval=20)

//TrueRange = max(max(high-low, abs(high-nz(close[1]))), abs(low-nz(close[1])))
//DirectionalMovementPlus = high-nz(high[1]) > nz(low[1])-low ? max(high-nz(high[1]), 0): 0
//DirectionalMovementMinus = nz(low[1])-low > high-nz(high[1]) ? max(nz(low[1])-low, 0): 0


//SmoothedTrueRange = nz(SmoothedTrueRange[1]) - (nz(SmoothedTrueRange[1])/len) + TrueRange
//SmoothedDirectionalMovementPlus = nz(SmoothedDirectionalMovementPlus[1]) - (nz(SmoothedDirectionalMovementPlus[1])/len) + DirectionalMovementPlus
//SmoothedDirectionalMovementMinus = nz(SmoothedDirectionalMovementMinus[1]) - (nz(SmoothedDirectionalMovementMinus[1])/len) + DirectionalMovementMinus

//DIPlus = sma(SmoothedDirectionalMovementPlus / SmoothedTrueRange * 100, len)
//DIMinus = sma(SmoothedDirectionalMovementMinus / SmoothedTrueRange * 100, len)
//DX = abs(DIPlus-DIMinus) / (DIPlus+DIMinus)*100
//ADX = sma(DX, len)


///
//ADX_longEntry = crossover(DIPlus, DIMinus) //or (DIPlus > DIMinus and DIPlus > th and ADX > th)
//ADX_shortEntry = crossover(DIMinus, DIPlus) //or (DIMinus > DIPlus and DIMinus > th and ADX > th)


//DI_long = if DIPlus > DIMinus and ADX > 20 and DIPlus > 20


//plot(DIPlus, color=green, title="DI+")
//plot(DIMinus, color=red, title="DI-")
//plot(ADX, color=black, title="ADX")
//hline(th, color=black, linestyle=dashed)


//////////////////////////////////Playing with RES


r1 = input("5", "Resolution")
r2 = input("15", "Resolution")
r3 = input("30", "Resolution")
r4 = input("60", "Resolution")

o1 = request.security(heikinashi(syminfo.tickerid), r1, MACD_Line[1])
c1 = request.security(heikinashi(syminfo.tickerid), r1, MACD_slowsignalLine[1])
o2 = request.security(heikinashi(syminfo.tickerid), r2, MACD_Line[1])
c2 = request.security(heikinashi(syminfo.tickerid), r2, MACD_slowsignalLine[1])
o3 = request.security(heikinashi(syminfo.tickerid), r3, MACD_Line[1])
c3 = request.security(heikinashi(syminfo.tickerid), r3, MACD_slowsignalLine[1])
o4 = request.security(heikinashi(syminfo.tickerid), r4, MACD_Line[1])
c4 = request.security(heikinashi(syminfo.tickerid), r4, MACD_slowsignalLine[1])

res_long = (o4 > c4 and o3 > c3 and o2 > c2 and o1 > c1)
res_short = (o4 < c4 and o3 < c3 and o2 < c2 and o1 < c1)

///////////////////// Parabolic SAR (stop and reverse)
start = input(0.02)
increment = input(0.02)
maximum = input(0.2)

psar = sar(start, increment, maximum)
plot(psar, style=circles, color=yellow)

psar_longEntry = close > psar
psar_longExit = crossunder(close, psar)
psar_shortEntry = close < psar//crossunder(close, psar)
psar_shortExit = crossover(close, psar)

mix = (moneyFlowIndex + rsi)/2
RSI_MFI = ema(mix, input(3))
//color = RSI_MFI > 80 ? red :RSI_MFI < 20  ? green : silver
vrsi = RSI_MFI

rsiBuySell = vrsi[1] < 95 and crossover(vrsi, 95) or vrsi[1] < 90 and crossover(vrsi, 90) or vrsi[1] < 85 and crossover(vrsi, 85) or vrsi[1] < 80 and crossover(vrsi, 80)  or vrsi[1] < 75 and crossover(vrsi, 75) or vrsi[1] < 70 and  crossover(vrsi, 70)  or vrsi[1] < 65 and crossover(vrsi, 65) or vrsi[1] < 60 and  crossover(vrsi, 60)  or vrsi[1] < 55 and crossover(vrsi, 55) or vrsi[1] < 50 and crossover(vrsi, 50) or vrsi[1] < 45 and crossover(vrsi, 45) or vrsi[1] < 40 and  crossover(vrsi, 40) or vrsi[1] < 35 and crossover(vrsi, 35) or vrsi[1] < 30 and crossover(vrsi, 30) or vrsi[1] < 25 and crossover(vrsi, 25) or vrsi[1] < 20 and  crossover(vrsi, 20) or vrsi[1] < 15 and crossover(vrsi, 15) or  vrsi[1] < 10 and crossover(vrsi, 10) or  vrsi[1] < 5 and crossover(vrsi, 5)  ? 1 :  vrsi[1] > 95 and  crossunder(vrsi, 95) or vrsi[1] > 90 and  crossunder(vrsi, 90) or  vrsi[1] > 85 and  crossunder(vrsi, 85) or vrsi[1] > 80 and crossunder(vrsi, 80) or  vrsi[1] > 75 and  crossunder(vrsi, 75) or vrsi[1] > 70 and  crossunder(vrsi, 70) or  vrsi[1] > 65 and  crossunder(vrsi, 65) or vrsi[1] > 60 and crossunder(vrsi, 60) or  vrsi[1] > 55 and  crossunder(vrsi, 55) or vrsi[1] > 50 and crossunder(vrsi, 50) or  vrsi[1] > 45 and  crossunder(vrsi, 45) or vrsi[1] > 40 and crossunder(vrsi, 40) or  vrsi[1] > 35 and  crossunder(vrsi, 35) or vrsi[1] > 30 and crossunder(vrsi, 30) or  vrsi[1] > 25 and  crossunder(vrsi, 25) or vrsi[1] > 20 and  crossunder(vrsi, 20) or vrsi[1] > 15 and crossunder(vrsi, 15) or vrsi[1] > 10 and crossunder(vrsi, 10) or  vrsi[1] > 5 and  crossunder(vrsi, 5) ?-1:na

//////////////////////////////////Entry Conditions
//
MA1 = ema(hlc3, input(3))
MA2 = wma(MA1, input(7))
MA3 = ema(MA2, input(2))
MA4 = wma(MA3, input(1))

buy =  close > MA4 or hlc3[1] < MA4 and hlc3 > MA4 and rsiBuySell == 1
sell = close < MA4 or hlc3[1] > MA4 and hlc3 < MA4 and rsiBuySell == -1

p=14

CO=close-open
HL=high-low

value1 = (CO + 2*CO[1] + 2*CO[2] + CO[3])/6
value2 = (HL + 2*HL[1] + 2*HL[2] + HL[3])/6

num=sum(value1,p)
denom=sum(value2,p)

RVI=denom!=0?num/denom:0

RVIsig=(RVI+ 2*RVI[1] + 2*RVI[2] + RVI[3])/6

//plot(RVI,color=white,style=line,linewidth=1)
//plot(RVIsig,color=orange,style=line,linewidth=1)

Tenkan_periods = input(9, minval=1, title="Conversion Line Periods"),
Kijun_periods = input(26, minval=1, title="Base Line Periods")
Senkou_Span_B_Length = input(50, minval=1, title="Lagging Span 2 Periods"),
Chikou_Span_Length = input(25, minval=1, title="Displacement")

donchian(len) => avg(lowest(len), highest(len))

Tenkan_sen = donchian(Tenkan_periods)
Kijun_sen = donchian(Kijun_periods)
Senkou_Span_A = avg(Tenkan_sen, Kijun_sen)
Senkou_Span_B = donchian(Senkou_Span_B_Length)

plot(Tenkan_sen, color=#0496ff, title="Conversion Line")
plot(Kijun_sen, color=#991515, title="Base Line")
plot(close, offset = -Chikou_Span_Length, color=#459915, title="Lagging Span")

p3 = plot(Senkou_Span_A, offset = Chikou_Span_Length, color=green,
 title="Lead 1")
p4 = plot(Senkou_Span_B, offset = Chikou_Span_Length, color=red,
 title="Lead 2")
fill(p3, p4, color = Senkou_Span_A > Senkou_Span_B ? green : red, transp=50)

Ichimoku_longEntry = Senkou_Span_B < Senkou_Span_A
Ichimoku_shortEntry = Senkou_Span_A < Senkou_Span_B

len9 = input(9, minval=1, title="Length")
srce = input(hlc3, title="Source")
ema9 = ema(srce, len9)
sma50 = sma(ema9, 80)
sma30 = vwma(sma50, 26)
ema930 = ema(sma30, 9)
//plot(ema930, color=blue, title="MA", linewidth=5, transp=0)

SMA100 = sma(input(ohlc4), input(10))
Lookback = SMA100[input(7)]
sma300 = SMA100 + (SMA100 - Lookback)


//if Ichimoku_longEntry
longEntry = (MACD_longEntry2) //or Stoch_longEntry// or buy //or cci_longEntry  or bb_longEntry or psar_shortExit //or  //// // KC_longEntry// or WilliamsR_longEntry//  // // or RSI_longEntry// // or  or MFI_longEntry// or crossover(close,psar) //(o4 < c4 and o3 < c3 and o2 < c2 and o1 < c1)

//if Ichimoku_shortEntry
shortEntry = (MACD_shortEntry2) //or Stoch_shortEntry// or sell//or cci_shortEntry or bb_shortEntry or psar_longExit//   // //or KC_shortEntry// or WilliamsR_shortEntry//  //or cci_shortEntry //  // or  or MFI_shortEntry// or crossunder(close,psar)// (o4 < c4 and o3 < c3 and o2 < c2 and o1 < c1)


//longExit = shortEntry or psar_longExit // if not (ADX > th and )
//shortExit = longEntry or psar_shortExit // if not (ADX > th and )

////psar for trailing stops or some other measure? we must have a good trailing stop.

///////////////////////////////Strategy Execution

if testPeriod()
    strategy.entry("Long", strategy.long, when=longEntry)
    strategy.close("Long", when=shortEntry)

//if testPeriod()
//    strategy.entry("Long", strategy.long, when=longEntry)
//    strategy.exit("Exit Long", "Long", when=shortEntry)
//else
//    strategy.cancel("Long")
//if testPeriod()
//    strategy.entry("Short", strategy.short, when=shortEntry)
//    strategy.exit("Exit Short", "Short", when=longEntry)
//else
//    strategy.cancel("Long")

//Other Plots and Alerts
plotshape(MACD_longEntry2,  title= "3,7 Long Open", color=green, style=shape.circle)
plotshape(MACD_shortEntry2,  title= "3,7 Short Open", color=red, style=shape.circle)
//plotshape(Stoch_longEntry,  title= "Stoch Long Open", color=aqua, style=shape.circle)
//plotshape(Stoch_shortEntry,  title= "Stoch Short Open", color=orange, style=shape.circle)
//plotshape(buy,  title= "RES Long Open", color=green, location=location.belowbar, style=shape.circle)
///plotshape(sell,  title= "RES Short Open", color=red, location=location.belowbar, style=shape.circle)
//plotshape(MACD_longEntry, title= "12,26 Long Open", color=green, style=shape.arrowup, size=size.normal, location=location.belowbar)
//plotshape(MACD_shortEntry, title= "12,26 Short Open", color=red, style=shape.arrowdown, size=size.normal, location=location.abovebar)
//plotshape(MACD_longEntry, title= "12,26 Long Open", color=green, style=shape.diamond, size=size.tiny, location=location.belowbar)
//plotshape(MACD_shortEntry, title= "12,26 Short Open", color=red, style=shape.diamond, size=size.tiny, location=location.abovebar)

//plotchar(longCondition, location=bottom char="L", color=green)
//plotchar(shortCondition, char="S", color=red)
//alertcondition(longCondition, title="MFI+MACD Long", message="(MFI crossOver 30) or MACD+")
//alertcondition(shortCondition, title="MFI+MACD Short", message="(MFI crossUnder 70) or MACD-")
plot(sma300, color=purple, linewidth=4)