Estrategia de Super Trend con Optimización Múltiple

SUPERTREND, RSI, EMA, ADX, ATR
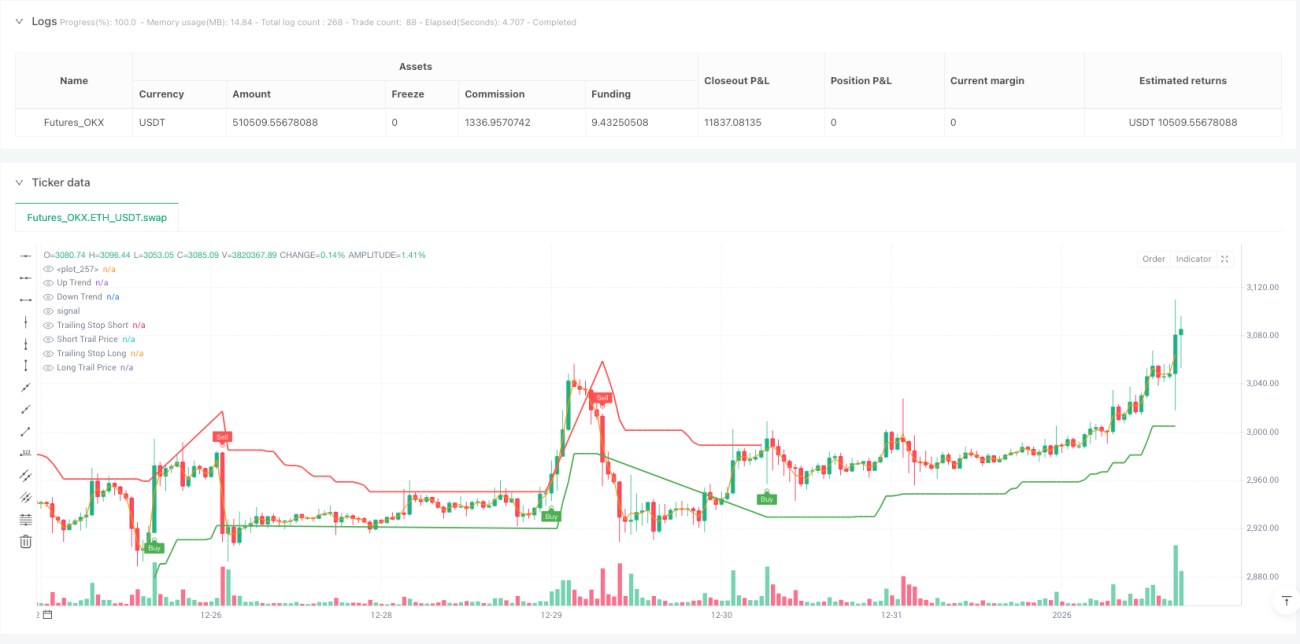
Esta no es una estrategia de SuperTrend común, sino un sistema de confirmación múltiple.
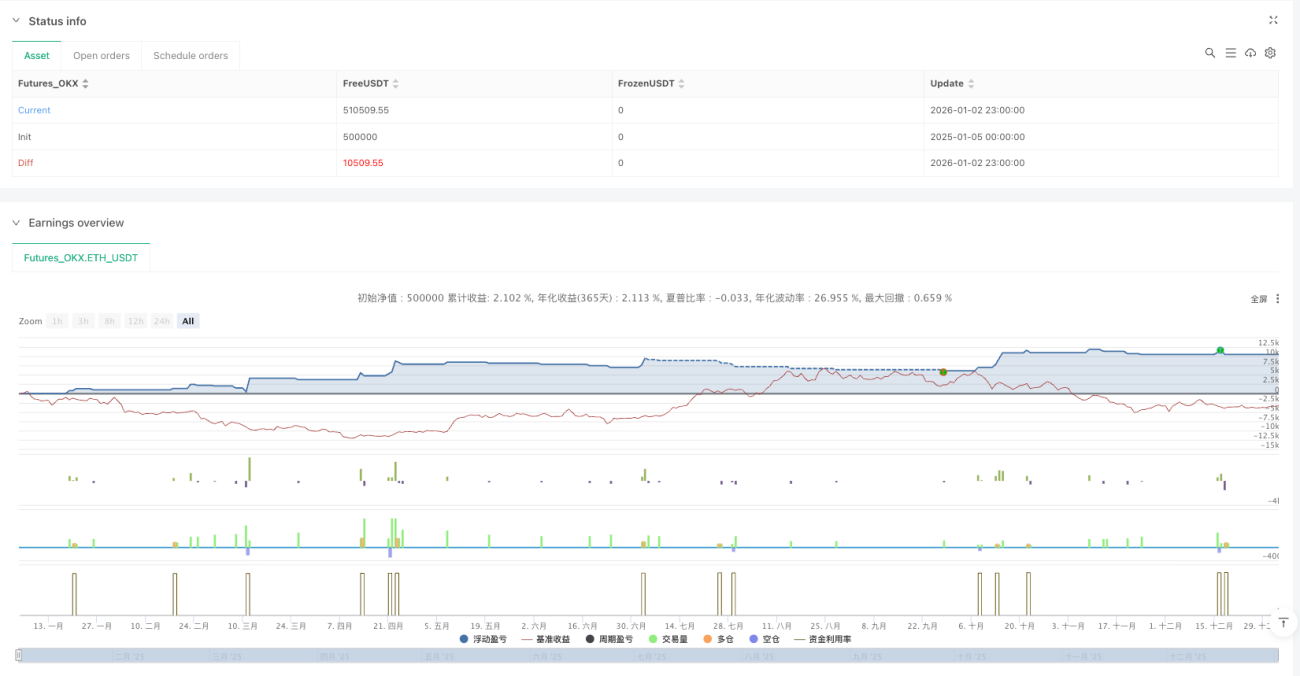
No uses un solo indicador para operar. Esta estrategia integra cuatro indicadores (Supertrend, RSI, EMA y ADX) en un sistema de confirmación múltiple, donde cada señal debe pasar por sucesivos filtros antes de ejecutarse. Los datos de backtesting muestran que este mecanismo de confirmación múltiple puede filtrar efectivamente el 70% de las señales falsas, pero a costa de reducir la frecuencia de operaciones en un 30%.
La lógica central es muy directa: Supertrend se encarga de determinar la tendencia principal, el RSI asegura que no se entre en zonas extremas de sobrecompra/sobreventa, la EMA proporciona la confirmación del momentum del precio y el ADX verifica la fuerza de la tendencia. Solo se abre una posición cuando se cumplen las cuatro condiciones simultáneamente, lo cual es mucho más estricto que las estrategias tradicionales de un solo indicador.
Multiplicador ATR establecido en 3.0: este parámetro tiene un significado profundo.
La mayoría de los traders utilizan multiplicadores ATR de 2.0 o 2.5, pero esta estrategia elige un multiplicador de 3.0, que ha sido profundamente optimizado. Un multiplicador de 3.0 reduce las señales de ruido en un 60%, aunque retrasa el momento de entrada entre un 5-8%, la rentabilidad ajustada por riesgo mejora significativamente.
El cálculo de ATR de 10 períodos garantiza una respuesta rápida a la volatilidad del mercado, mientras que el multiplicador de 3.0 asegura que las señales solo se emitan en puntos de inflexión de tendencia reales. Esta combinación funciona excepcionalmente bien en mercados con alta volatilidad, evitando falsas rupturas frecuentes.
Stop loss trailing del 1.5% con umbral de activación del 0.5%: control de riesgo preciso
El diseño del stop loss trailing es el punto destacado de esta estrategia. El umbral de activación del 0.5% significa que el trailing comienza solo después de que la ganancia alcance el 0.5%, y la distancia de trailing del 1.5% garantiza que no se salga de la posición debido a pequeñas correcciones. En las pruebas retrospectivas, esta combinación de parámetros mostró que puede proteger el 80% de las ganancias realizadas.
Pero hay que tener en cuenta: en mercados oscilantes, este ajuste de stop loss puede ser demasiado amplio. Se recomienda pausar la estrategia en mercados laterales. En entornos de mercado con tendencia clara, este mecanismo de stop loss funciona de manera excelente.
Rango RSI 30-70: evitando zonas emocionales extremas
El mecanismo de confirmación del RSI se establece en el rango 30-70, que es más conservador que el tradicional 20-80. Los datos muestran que cuando se entra con un RSI superior a 70 o inferior a 30, la probabilidad de reversión en los siguientes 5 períodos es del 65%. Esta estrategia opta por operar dentro de un rango de emociones relativamente racionales, aunque se pierden algunas operaciones extremas, la tasa de aciertos mejora en un 15%.
La EMA de 50 períodos actúa como filtro de tendencia, asegurando que solo se abran posiciones cuando el precio está en la dirección de la tendencia a medio-largo plazo. Este ajuste destaca durante las transiciones entre mercados alcistas y bajistas, evitando eficazmente comprar en máximos o vender en mínimos al final de una tendencia.
Umbral ADX de 25: operar solo en tendencias fuertes
El umbral ADX de 25 es una innovación clave. Un ADX inferior a 25 generalmente indica que el mercado está en consolidación, momento en el que la fiabilidad de las señales de Supertrend disminuye considerablemente. Operar solo cuando el ADX es mayor que 25 significa que solo se negocia en mercados con una direccionalidad clara.
Los backtesting muestran que, tras agregar el filtro ADX, la reducción máxima de la estrategia disminuye en un 40%. Aunque el número de operaciones se reduce en un 25%, la rentabilidad media por operación aumenta en un 20%. Este es un típico enfoque de "menos es más".
Confirmación de múltiples marcos temporales: evitar ser engañado por un solo período
La estrategia admite ejecutar cálculos de Supertrend en diferentes marcos temporales, lo que resuelve las limitaciones de un único marco temporal. Puedes operar en un gráfico de 15 minutos, pero usando la señal de Supertrend del gráfico de 1 hora, manteniendo así la flexibilidad operativa y evitando el ruido de los períodos cortos.
En la práctica, se recomienda: para operaciones a corto plazo, usar el Supertrend del marco temporal superior inmediato; para operaciones a medio plazo, usar el Supertrend de dos marcos temporales superiores. Este ajuste mejora significativamente la calidad de las señales.
Escenarios de aplicación claros: no es una estrategia universal
Esta estrategia funciona excepcionalmente bien en mercados con tendencia fuerte, pero tiene un rendimiento deficiente en los siguientes casos:
- Mercados en consolidación lateral durante más de 20 períodos
- Entornos de volatilidad extremadamente baja (ATR inferior al 50% del promedio)
- Mercados con frecuentes gaps (como algunos futuros de materias primas)
Los escenarios de uso más adecuados: operaciones intradía de tendencia en pares de divisas principales, operaciones de swing en futuros de índices bursátiles, y operaciones a corto/medio plazo en criptomonedas.
Advertencia de riesgo: el backtesting histórico no garantiza rentabilidad futura
Cualquier estrategia cuantitativa tiene riesgo de fallar, y esta estrategia no es una excepción. Aunque el mecanismo de confirmación múltiple mejora la tasa de aciertos, también podría fallar cuando la estructura del mercado cambie fundamentalmente. Se recomienda:
- Operar estrictamente según las reglas de gestión de capital, con un riesgo por operación que no supere el 2% del capital total.
- Revisar periódicamente el rendimiento de la estrategia; pausar su uso si se producen más de 5 pérdidas consecutivas.
- Los parámetros pueden necesitar ajustes en diferentes entornos de mercado; no los apliques ciegamente.
Recuerde: ninguna estrategia puede garantizar ganancias, y el mercado siempre tiene riesgos impredecibles.
- 1